Exemptions from Real Property Taxation in New York State: 2024 County, City, and Town Assessment Rolls
Introduction
All real property in New York is subject to taxation unless specific legal provisions grant it exempt status, whereas personal property is not subject to taxation. Real property tax exemptions are granted on the basis of many different criteria, including the use to which the property is put, the owner's ability to pay taxes, the desire of the state and local governments to encourage certain economic or social activities, and other such considerations.1 Certain exemptions provide full relief from taxation (wholly exempt property) and others reduce the taxes which would otherwise be payable by varying degrees (partially exempt property). Some exemptions apply to taxes levied for county, city/town, and school purposes, whereas others pertain only to some of these purposes. Yet another difference involves the extent of local government autonomy: while some exemptions are mandated by state law, others are subject to local option and/or local determination of eligibility criteria.
This report presents exemption data for 2024 assessment rolls prepared by local assessors throughout New York.2 It covers town, city, and county (Tompkins and Nassau Counties) assessment rolls only; village rolls are not included.
Ultimately, the accuracy of the figures presented depends on the accuracy of the data submitted on the rolls. Although the overwhelming majority of reported exemptions could be related to specific legal provisions through the standardized reporting system provided by NYS Department of Taxation and Finance, Office of Real Property Tax Services (ORPTS), a very small percentage could not be classified because incorrect codes were used, and are thus omitted from certain tables in this report. Similarly, any errors made by assessors in determining the value of a parcel, or the extent to which this value is exempt from taxation, will appear in the data contained herein. Also, experience has shown that some assessors may not keep the values placed on wholly exempt property fully up to date, as valuation of such property has, for the most part, no effect on local tax revenue. Incorrect assessed values may overstate or understate the effect of exemptions on local tax bases.
The remainder of the report presents a summary of the 2024 statewide statistics on exempt property in graphic and tabular format, followed by Appendix A, which contains a list of abbreviations and definitions for terms used in the detailed tables that comprise Appendix B.
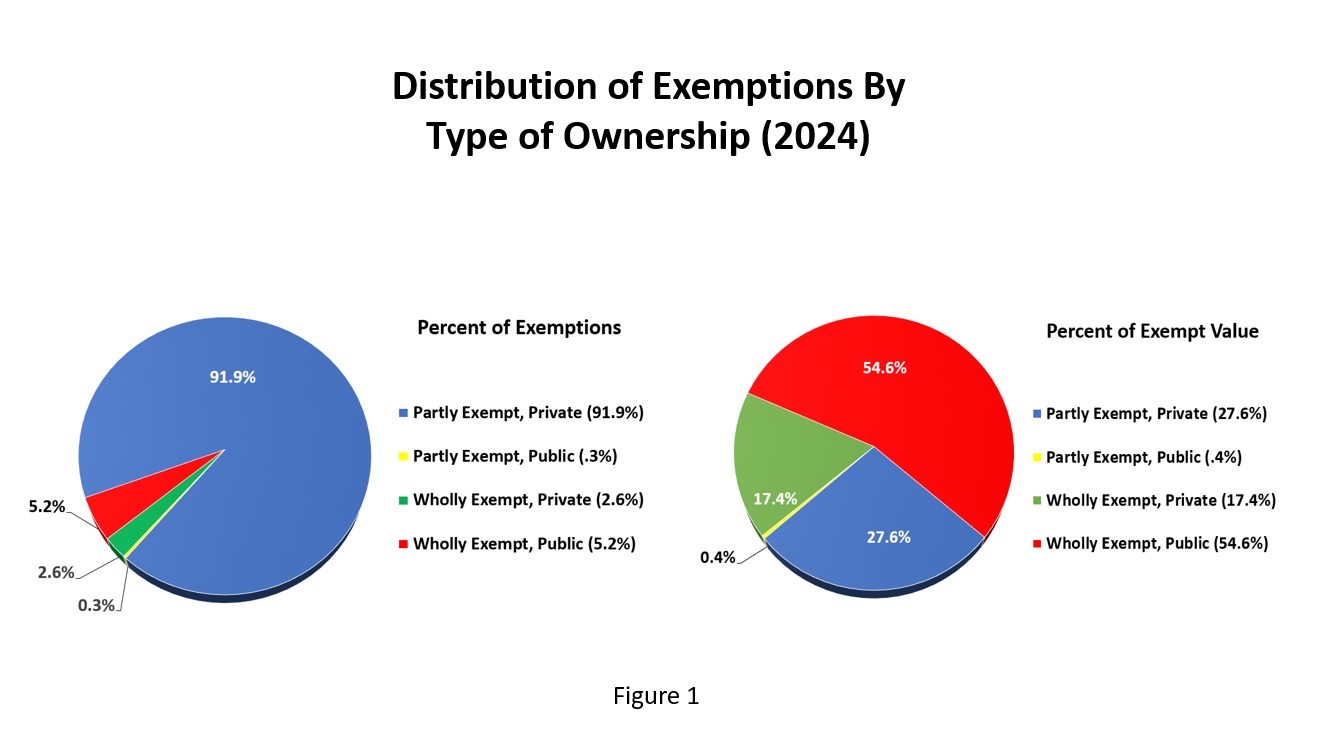
Figure 1: Two pie charts labeled Distribution of Exemptions By Type of Ownership (2024). Pie chart 1 shows the Percent of Exemptions as Partly Exempt, Private (91.9%), Partly Exempt, Public (0.3%), Wholly Exempt, Private (2.6%) and Wholly Exempt, Public (5.2%). Pie chart 2 shows Percent of Exempt Value as Partly Exempt, Private (27.6%), Partly Exempt, Public (0.4%), Wholly Exempt, Private (17.4%) and Wholly Exempt, Public (54.6%).
Table 1. Real Property tax exemptions by property group, 2024 assessment rolls
Table 1. Real Property tax exemptions, 2024 rolls
Group
Number of exemptions
Equalized Exempt Value ($000)
A.
Residential Property other than Multiple Dwellings Non-Residential Property Owned by Certain Individuals
2,473,727
194,667,583
B.
Property of New York State Government and Agencies
21,512
139,928,774
C.
Property of Municipal Governments and Agencies, School Districts, BOCES, and Special Districts
115,424
279,301,041
D.
Property of U.S. and Foreign Governments and Agencies, International or Interstate Agencies, and Indian Tribes
4,886
72,963,929
E.
Property of Private Community Service Organizations, Social Organizations, and Professional Societies
71,762
169,194,637
F.
Industrial, Commercial, and Public Service Property
18,834
95,929,344
G.
Urban Renewal Property, Public Housing, and Private Subsidized Housing (Multiple Dwellings)
86,538
114,882,547
H.
Agricultural and Forest Properties
116,010
15,091,763
Total, Valid Exemption Codes
2,908,693
1,081,959,618
Invalid Codes
3,807
1,977,441
TOTAL
2,912,500
1,083,937,059
Table 2. Exemptions for county purposes: Geographic areas with highest and lowest incidence of exempt value, 2024 assessment rolls
A. Ten with highest incidence
Rank
Counties
Cities
Towns
Name
Pct. exempt
Name
Pct. exempt
Name
Pct. exempt
1.
Tompkins
37.89%
Salamanca (Cat.)
68.88%
Scriba (Osw.)
84.02%
2.
Seneca
37.04%
Rensselaer (Ren.)
66.93%
Alfred (All.)
78.73%
3.
Oswego
36.01%
Ithaca (Tom.)
58.39%
Blenheim (Scho.)
74.24%
4.
St Lawrence
35.50%
Albany (Alb.)
55.09%
Romulus (Sen.)
74.04%
5.
Oneida
33.49%
Syracuse (Ono.)
51.05%
Marcy (One.)
71.80%
6.
Niagara
31.37%
Ogdensburg (St. L.)
49.40%
Ashford (Cat.)
71.04%
7.
Allegany
30.56%
Peekskill (Wes.)
49.21%
Greenwood (Ste.)
70.16%
8.
Schoharie
30.52%
Geneva (Ont.)
48.16%
Massena (St. L.)
68.40%
9
Albany
29.22%
Oneonta (Ots.)
47.18%
Verona (One.)
68.00%
10.
Wyoming
28.54%
Watervliet (Alb.)
46.20%
Lewiston (Nia.)
66.23%
B. Ten with lowest incidence
Rank
Counties
Cities
Towns
Name
Pct. exempt
Name
Pct. exempt
Name
Pct. exempt
1.
Hamilton
8.05%
Mechanicville (Sar.)
7.72%
Benson (Ham.)
0.96%
2.
Putnam
9.44%
Tonawanda (Eri.)
11.98%
Inlet I(Ham.)
1.83%
3.
Warren
9.88%
Sherrill (One.)
12.30%
Arietta (Ham.)
1.96%
4.
Saratoga
12.33%
Lockport (Nia.)
12.59%
Stratford (Ful.)
2.70%
5.
Washington
12.49%
Rye (Wes.)
13.24%
Hope (Ham.)
2.80%
6.
Ulster
13.51%
Beacon (Dut.)
14.10%
Dresden (Was.)
3.00%
7.
Columbia
14.09%
Long Beach (Nas.)
14.23%
Bolton (War.)
3.08%
8.
Greene
15.03%
North Tonawanda (Nia.)
15.51%
Ellicottville (Cat.)
3.08%
9.
Fulton
15.53%
Saratoga Springs (Sar.)
17.99%
Bleecker (Ful.)
3.17%
10.
Rockland
16.10%
Lackawanna (Eri.)
19.24%
Horicon (War.)
3.23%
Table 3. Exemptions for county purposes: Counties ranked by percent of full value exempt, 2024 assessment rolls*
Table 3. Exemptions for county purposes: Counties ranked by percent of full value exempt, 2024 rolls*
Rank
County
No. of exemptions
Exempt value ($000)
Pct. of value exempt
1.
Tompkins
7,055
6,982,276
37.89%
2.
Seneca
4,922
2,040,783
37.04%
3.
Oswego
11,162
5,176,411
36.01%
4.
St Lawrence
12,542
4,460,170
35.50%
5.
Oneida
21,295
8,981,663
33.49%
6.
Niagara
18,604
8,937,175
31.37%
7.
Allegany
7,148
1,370,503
30.56%
8.
Schoharie
5,104
1,574,800
30.52%
9.
Albany
21,149
15,376,705
29.22%
10.
Wyoming
7,127
1,415,700
28.54%
11.
Jefferson
11,787
4,265,206
27.87%
12.
Tioga
4,998
1,394,538
26.62%
13.
Rensselaer
12,431
5,907,708
26.13%
14.
Cattaraugus
10,549
2,433,249
26.02%
15.
Broome
13,270
4,685,222
25.53%
16.
Yates
4,590
1,341,042
24.97%
17.
Chautauqua
16,257
3,574,217
24.64%
18.
Montgomery
6,364
1,254,408
24.41%
19.
Livingston
7,662
1,711,206
24.18%
20.
Onondaga
38,923
13,580,129
23.53%
21.
Lewis
5,122
969,104
23.52%
22.
Steuben
15,144
2,461,269
23.34%
23.
Genesee
8,223
1,293,134
22.55%
24.
Franklin
5,068
1,648,758
22.39%
25.
Sullivan
8,389
4,468,571
22.37%
26.
Cayuga
10,175
2,143,791
22.10%
27.
Schenectady
9,650
4,282,000
22.01%
28.
Westchester
33,044
63,789,136
21.21%
29.
Cortland
5,028
1,003,566
21.08%
30.
Otsego
6,756
1,670,652
20.60%
31.
Madison
8,401
1,621,689
20.45%
32.
Clinton
8,900
1,918,382
20.39%
33.
Chenango
6,129
879,872
20.15%
34.
Dutchess
19,963
11,763,909
19.77%
35.
Suffolk
119,317
122,587,631
19.62%
36.
Orleans
5,539
656,170
19.49%
37.
Chemung
7,279
1,477,019
19.36%
38.
Herkimer
6,577
1,710,190
19.18%
39.
Ontario
10,817
3,428,856
18.66%
40.
Nassau
111,344
81,005,105
18.62%
41.
Wayne
9,769
1,893,287
18.24%
42.
Orange
24,562
12,324,910
17.95%
43.
Erie
70,907
22,546,474
17.69%
44.
Monroe
55,269
15,723,908
17.64%
45.
Schuyler
3,187
525,197
17.07%
46.
Delaware
5,333
1,784,772
16.43%
47.
Essex
5,335
1,943,852
16.15%
48.
Rockland
15,874
11,293,502
16.10%
49.
Fulton
5,016
1,006,734
15.53%
50.
Greene
5,553
1,914,971
15.03%
51.
Columbia
7,621
2,366,782
14.09%
52.
Ulster
14,565
5,175,224
13.51%
53.
Washington
8,040
1,045,467
12.49%
54.
Saratoga
16,506
5,630,848
12.33%
55.
Warren
6,632
1,766,203
9.88%
56.
Putnam
6,585
2,085,698
9.44%
57.
Hamilton
846
343,691
8.05%
*Excludes New York City boroughs; New York City data included in Table 4
Table 4. Exemptions for county purposes: Cities ranked by percent of full value exempt, 2024 assessment rolls
Table 4. Exemptions for county purposes: Cities ranked by percent of full value exempt, 2024 rolls
Rank
City
No. of exemptions
Exempt value ($000)
Pct. of value exempt
1.
Salamanca
1,449
276,843
68.88%
2.
Rensselaer
446
1,374,431
66.93%
3.
Ithaca
857
3,914,479
58.39%
4.
Albany
6,034
9,233,109
55.09%
5.
Syracuse
7,268
7,313,680
51.05%
6.
Ogdensburg
782
349,062
49.40%
7.
Peekskill
846
2,644,632
49.21%
8.
Geneva
748
675,529
48.16%
9.
Oneonta
501
575,683
47.18%
10.
Watervliet
361
515,438
46.20%
11.
Troy
1,953
2,381,025
46.04%
12.
Niagara Falls
3,588
2,152,908
45.48%
13.
Rome
2,802
1,518,953
44.78%
14.
Little Falls
315
218,269
44.45%
15.
Jamestown
2,174
591,655
39.42%
16.
Elmira
1,567
581,077
38.89%
17.
Schenectady
3,154
2,138,780
37.13%
18.
Utica
3,483
1,577,220
36.70%
19.
Yonkers
5,357
14,584,869
35.63%
20.
Olean
1,093
351,481
35.09%
21.
Binghamton
2,267
1,107,332
34.84%
22.
Norwich
334
163,594
34.65%
23.
Cortland
769
434,798
33.34%
24.
Watertown
1,549
680,771
32.54%
25.
White Plains
1,210
5,571,691
32.25%
26.
Poughkeepsie
1,069
1,259,847
32.16%
27.
Johnstown
581
312,832
31.40%
28.
Plattsburgh
1,070
575,273
30.86%
29.
Oswego
1,036
572,943
30.55%
30.
Dunkirk
1,064
249,660
30.20%
31.
Canandaigua
564
494,287
29.92%
32.
Amsterdam
1,172
364,273
29.83%
33.
Auburn
1,769
611,143
29.75%
34.
Oneida
1,107
282,250
29.07%
35.
New Rochelle
1,811
5,470,851
28.67%
36.
Buffalo
18,002
7,773,263
28.59%
37.
Hornell
771
137,155
28.48%
38.
Hudson
408
384,714
26.58%
39.
Kingston
1,392
1,004,527
25.49%
40.
Newburgh
911
691,192
25.37%
41.
Gloversville
919
184,605
24.93%
42.
New York City
168,858
456,264,001
24.37%
43.
Mt Vernon
1,420
2,371,402
23.82%
44.
Corning
854
245,340
23.49%
45.
Cohoes
804
397,832
23.07%
46.
Rochester
10,872
3,472,892
22.85%
47.
Glens Falls
941
431,826
22.74%
48.
Fulton
774
158,894
22.45%
49.
Batavia
1,022
240,815
22.10%
50.
Middletown
1,090
694,109
21.21%
51.
Port Jervis
533
184,237
19.39%
52.
Glen Cove
1,548
1,353,366
19.35%
53.
Lackawanna
1,238
246,618
19.24%
54.
Saratoga Springs
1,299
1,590,454
17.99%
55.
North Tonawanda
2,875
498,049
15.51%
56.
Long Beach
2,635
1,363,595
14.23%
57.
Beacon
685
346,598
14.10%
58.
Rye
450
1,791,882
13.24%
59.
Lockport
1,216
189,451
12.59%
60.
Sherrill
63
40,559
12.30%
61.
Tonawanda
1,423
176,658
11.98%
62.
Mechanicville
217
28,920
7.72%
Table 5. Exemptions for county purposes: Towns with over 50 percent full value exempt, 2024 assessment rolls
Table 5. Exemptions for county purposes: Towns with over 50 percent full value exempt, 2024 rolls
Rank
Town
No. of exemptions
Exempt value ($000)
Pct. of value exempt
1.
Scriba (Osw.)
638
3,034,345
84.02%
2.
Alfred (All.)
320
554,643
78.73%
3.
Blenheim (Scho.)
129
184,953
74.24%
4.
Romulus (Sen.)
404
903,351
74.04%
5.
Marcy (One.)
584
1,924,003
71.80%
6.
Ashford (Cat.)
353
533,625
71.04%
7.
Greenwood (Ste.)
314
183,837
70.16%
8.
Massena (St. L.)
1,024
1,487,411
68.40%
9.
Verona (One.)
1,005
1,082,419
68.00%
10.
Lewiston (Nia.)
1,306
4,092,857
66.23%
11.
Dover (Dut.)
557
2,109,778
65.49%
12.
Le Ray (Jef.)
811
1,152,930
63.85%
13.
Harrisburg (Lew.)
260
100,265
62.30%
14.
Tyre (Sen.)
309
178,433
60.59%
15.
Arkwright (Cha.)
205
162,893
59.38%
16.
Nichols (Tio.)
271
285,720
57.74%
17.
Cherry Creek (Cha.)
262
120,534
55.93%
18.
Cohocton (Ste.)
704
212,042
55.09%
19.
Delhi (Del.)
339
640,271
52.85%
20.
Wethersfield (Wyo.)
324
98,986
52.69%
21.
Orangeville (Wyo.)
306
172,676
52.25%
22.
Orleans (Jef.)
359
611,058
51.82%
23.
Fairfield (Her.)
351
156,032
51.68%
24.
Martinsburg (Lew.)
419
159,317
51.11%
25.
Eaton (Mad.)
638
308,554
50.50%
Table 6. Geographic areas with highest and lowest incidence of local-option exempt value, 2024 assessment rolls
A. Ten with highest incidence
Rank
Counties
Cities
Towns
Name
Pct. local-option*
Name
Pct. local-option*
Name
Pct. local-option*
1.
Fulton
24.35%
Johnstown (Ful.)
41.32%
Ontario (Way.)
64.14%
2.
Wayne
20.56%
Saratoga Springs (Sar.)
31.20%
Shelter Island (Suf.)
47.88%
3.
Hamilton
20.32%
Auburn (Cay.)
26.81%
Lake Pleasant (Ham.)
45.81%
4.
Oswego
20.03%
Lackawanna (Eri.)
19.76%
Jewett (Gre.)
44.32%
5.
Monroe
19.18%
Tonawanda (Eri.)
19.11%
Chautauqua (Cha.)
44.28%
6.
Nassau
18.31%
Buffalo (Eri.)
18.23%
Rhinebeck (Dut.)
40.30%
7.
Saratoga
17.87%
Rochester (Mon.)
17.57%
Warren (Her.)
38.04%
8.
Putnam
17.82%
Poughkeepsie (Dut.)
16.01%
Piercefield (St. L.)
35.12%
9.
Columbia
16.17%
Newburgh Ora.)
15.66%
Fenner (Mad.)
34.36%
10.
Washington
16.13%
North Tonawanda (Nia.)
15.25%
Westerlo (Alb.)
34.14%
B. Ten with lowest incidence
Rank
Counties
Cities
Towns
Name
Pct. local-option*
Name
Pct. local-option*
Name
Pct. local-option*
1.
Allegany
3.52%
Little Falls (Her.)
1.99%
Red House (Cat.)
0.00%
2.
Tompkins
3.57%
Ithaca (Tom.)
2.04%
Blenheim (Scho.)
0.26%
3.
Wyoming
3.89%
White Plains (Wes.)
2.36%
Harrisburg (Lew.)
0.37%
4.
Seneca
4.06%
Rensselaer (Ren.)
2.65%
Alfred (All.)
0.46%
5.
Yates
4.33%
Binghamton (Bro.)
2.66%
Clare (St. L.)
0.62%
6.
Schuyler
4.79%
Albany (Alb.)
3.27%
Romulus (Sen.)
0.69%
7.
Schoharie
5.11%
Watervliet (Alb.)
3.36%
Dover (Dut.)
0.89%
8.
Delaware
5.14%
Peekskill (Wes.)
3.50%
Ashford (Cat.)
0.98%
9.
Cattaraugus
5.28%
Ogdensburg (St. L.)
3.68%
Orleans (Jef.)
0.98%
10.
St Lawrence
5.30%
Salamanca (Cat.)
3.96%
Cherry Creek (Cha.)
0.99%
*Exempt value of local-option exemptions divided by total exempt value.
Table 7. Exempt value attributable to local option, counties ranked by percent of exempt value, 2024 assessment rolls
Table 7. Exempt value attributable to local option, counties ranked by percent of exempt value, 2024 rolls
Rank
County
Exempt value local option ($000)
Total exempt value ($000)
Pct. of value exempt
1.
Fulton
381,552
1,566,649
24.35%
2.
Wayne
587,969
2,860,000
20.56%
3.
Hamilton
83,406
410,383
20.32%
4.
Oswego
1,242,050
6,201,682
20.03%
5.
Monroe
4,033,072
21,026,924
19.18%
6.
Nassau
18,315,440
100,052,602
18.31%
7.
Saratoga
1,355,112
7,581,943
17.87%
8.
Putnam
552,663
3,101,699
17.82%
9.
Columbia
479,189
2,963,529
16.17%
10.
Washington
260,647
1,615,952
16.13%
11.
Warren
352,331
2,308,746
15.26%
12.
Ulster
991,348
6,744,102
14.70%
13.
Onondaga
2,444,134
16,933,279
14.43%
14.
Erie
4,379,027
30,388,867
14.41%
15.
Rockland
2,042,478
14,283,210
14.30%
16.
Cayuga
385,393
2,827,359
13.63%
17.
Dutchess
1,816,550
14,203,646
12.79%
18.
Greene
323,679
2,535,596
12.77%
19.
Orange
1,852,433
14,996,750
12.35%
20.
Rensselaer
855,671
7,058,239
12.12%
21.
Cortland
162,620
1,372,264
11.85%
22.
Suffolk
16,020,711
138,812,706
11.54%
23.
Essex
253,029
2,304,926
10.98%
24.
Orleans
109,954
1,018,601
10.79%
25.
Chautauqua
487,706
4,734,057
10.30%
26.
Livingston
216,871
2,242,743
9.67%
27.
Clinton
240,982
2,555,351
9.43%
28.
Montgomery
156,577
1,719,035
9.11%
29.
Schenectady
486,243
5,402,162
9.00%
30.
Broome
535,471
6,283,798
8.52%
31.
Chenango
111,086
1,307,411
8.50%
32.
Steuben
276,835
3,293,360
8.41%
33.
Chemung
171,945
2,175,969
7.90%
34.
Albany
1,359,267
17,249,986
7.88%
35.
Ontario
344,641
4,388,672
7.85%
36.
Otsego
166,323
2,199,617
7.56%
37.
Genesee
135,190
1,804,199
7.49%
38.
Westchester
5,286,169
72,893,069
7.25%
39.
Herkimer
165,383
2,314,070
7.15%
40.
Oneida
752,057
10,873,411
6.92%
41.
Madison
153,551
2,229,848
6.89%
42.
Lewis
84,877
1,233,227
6.88%
43.
Jefferson
323,702
4,966,579
6.52%
44.
Sullivan
329,101
5,057,866
6.51%
45.
Tioga
119,946
1,926,082
6.23%
46.
Niagara
620,508
10,891,379
5.70%
47.
Franklin
115,656
2,054,566
5.63%
48.
St Lawrence
283,849
5,356,677
5.30%
49.
Cattaraugus
165,131
3,125,151
5.28%
50.
Delaware
117,296
2,283,418
5.14%
51.
Schoharie
95,652
1,873,075
5.11%
52.
Schuyler
33,663
703,338
4.79%
53.
Yates
67,371
1,556,469
4.33%
54.
Seneca
95,715
2,359,829
4.06%
55.
Wyoming
69,173
1,780,422
3.89%
56.
Tompkins
268,392
7,512,516
3.57%
57.
Allegany
62,797
1,783,672
3.52%
Table 8. City/Town distribution of exempt value attributable to local option exemptions: 2024 assessment rolls
Table 8. City/Town distribution of exempt value attributable to local option exemptions: 2024 rolls
Percent of value in local option exemptions
Number of cities/towns
Percent of cities/towns
0 - 9.99
530
53.266%
10 - 19.99
347
34.874%
20 - 20.99
92
9.246%
30 - 30.99
18
1.809%
40 or more
8
0.804%
1 Most exemptions are granted under Article 4 of the Real Property Tax Law, but others are authorized by a wide variety of statutes ranging from the Agriculture and Markets Law to the Transportation Law.
2The material in the report relates to exemptions only. Not covered are the restricted assessments which apply to certain types of property (e.g., condominiums), tax abatement programs, and formerly real property which has been statutorily redefined as personal (non-taxable) property (e.g., certain switching equipment owned by telephone companies). Restricted assessments, tax abatements, and statutory redefinitions, like exemptions, are tax expenditures in that they reduce or shift tax liability.