Compensating local governments for loss of tax base due to State ownership of land
September 1996
III. Equity of current compensation programs
The non-uniformity of New York's existing tax and PILOT programs was explained in Part II of this report. Piecemeal addition of new tax and PILOT payments for certain properties over a period of 110 years, with no evidence that a guiding policy or principle was followed in the majority of cases, virtually assured this non-uniform outcome. The present section will discuss the pattern of payments that has resulted under the current programs and will attempt to measure the extent of "inequity" they produce.
According to Table 6, New York State owns 13.2 percent of the land within its borders. That is a total of just over four million acres (transportation property, public utility property, and smaller improved parcels used for state facilities have been excluded). Tax payments are currently made to local governments on 89 percent of this acreage. In addition, PILOTs are paid on certain state properties, with the majority of PILOT revenue traditionally going to local governments in Adirondack and Catskill counties and, more recently, to those in Putnam County.
The majority of state acreage is in the forest preserve counties, with four counties having at least one-third of their land area owned by the state: Hamilton (71.1 percent); Essex (45.6 percent); Herkimer (40.1 percent); and Warren (34.3 percent). Only one percent or less of the state land in these and other Adirondack and Catskill counties is exempt, the remainder generally being taxable for all purposes by virtue of its status as forest preserve. Putnam county leads the state in terms of the percentage of its land area occupied by exempt state land (8.4 percent), and only two other counties exceed five percent: Suffolk (5.6 percent), and Onondaga (5.4 percent).
Table 7 shows the top twenty towns as ranked by percentage of land area owned by the state. In all of these municipalities, at least 40 percent of the land area is owned by the state, and in three the state's share is more than 90 percent of the municipality. It is thus apparent that state land is very unevenly distributed, with some municipalities dramatically affected by state ownership. It is also instructive to note that the state, despite its patchwork compensation programs, appears to have recognized the special situations of these twenty municipalities: virtually all acreage within their borders is currently taxable.
Taxable programs
The differential treatment of taxable state land among the several types of local taxing units (counties, cities/towns. villages, and school districts) is shown in Table 8. It is apparent from the data that some counties (such as Hamilton and Essex) are advantaged insofar as most or all of their acreage is taxable for all purposes, while others (such as Chautauqua, Dutchess, or Erie) are disadvantaged through the state's policy of making their acreage taxable for some purposes but not for others. Of the 57 counties, plus New York City, having eligible state land, only 25 have any acreage that is taxable for all local taxing purposes. Six counties have acreage that is taxable for school purposes only. And seven counties, plus New York City, have land which is not taxable for any local taxing purpose.
Like the geographic distribution of state lands and their variable taxable status, the distribution of state tax payments to localities is similarly lumpy. Table 9 shows that the local governments in some counties receive millions of dollars in taxes, while those in others receive little or no taxes. In some cases, the relatively high payments can be explained by the presence of vast state-owned acreage, such as in the Adirondack and Catskill counties. However, the two counties receiving the largest annual payments (Rockland, $10.6 million; Suffolk, $8. 1 million) do not have forest preserve or even relatively high acreage of taxable state-owned land. The explanation for their large payments lies in the fact that they have high-priced land. The high land values in question can sustain high taxes per-acre: $322 in Rockland County (taxable for all purposes) and $1,751 in Suffolk County (taxable for school purposes only). In contrast, the average statewide tax payment per acre was $16.36, and the average in fifteen of the counties was less than $10.00 per acre.
PILOT programs
PILOT-type payments also show a very uneven distribution (Table 9). The largest ones, amounting to approximately $17 million, went to local governments in seven Adirondack-area counties, in the form of payments on transition assessments, aggregate additional assessments, and river regulating district assessments (see Part 11). In virtually all of these cases. the payments were made to mitigate or eliminate any potential reduction in the state's tax liability as a result of local reassessment projects.
Particularly large payments (over $1 million total) were made to two Westchester County municipalities, the Town of Cortlandt and the Village of Buchanan. These payments were the result of transition assessments invoked by the takeover of a portion of the Indian Point nuclear facility by the State Power Authority. Other major payments include the special PILOT of $400,000 approved for Putnam County in 1994 and the payment of more than $240,000 to Cattaraugus County local governments, primarily as compensation for the West Valley Nuclear Waste Facility in the Town of Ashford. Major PILOT payments were also made in a few Catskill-area counties, again related to transition assessments associated with state-owned parklands. Statewide, combined tax and PILOT payments amounted to $19.73 per acre of land (taxable plus exempt) owned by the state, with tax payments representing approximately three-quarters of this total and PILOTs representing about one-quarter.
Equity concepts
While many different concepts of equity in the distribution of tax and/or PILOT payments could be envisioned, perhaps the simplest of all would be the idea that communities would receive payments in direct proportion to their shares of the total acreage owned by the state. Under such a plan, a community containing ten percent of New York's State's land would receive ten percent of any payments the state made that were not tied to specific local government service charges (service charge payments would be a function of the services supplied to specific state properties and would thus vary from community to community). The huge differences observed in per-acre payments under existing programs (Table 9) suggest that the current reality differs substantially from this simple model, however.
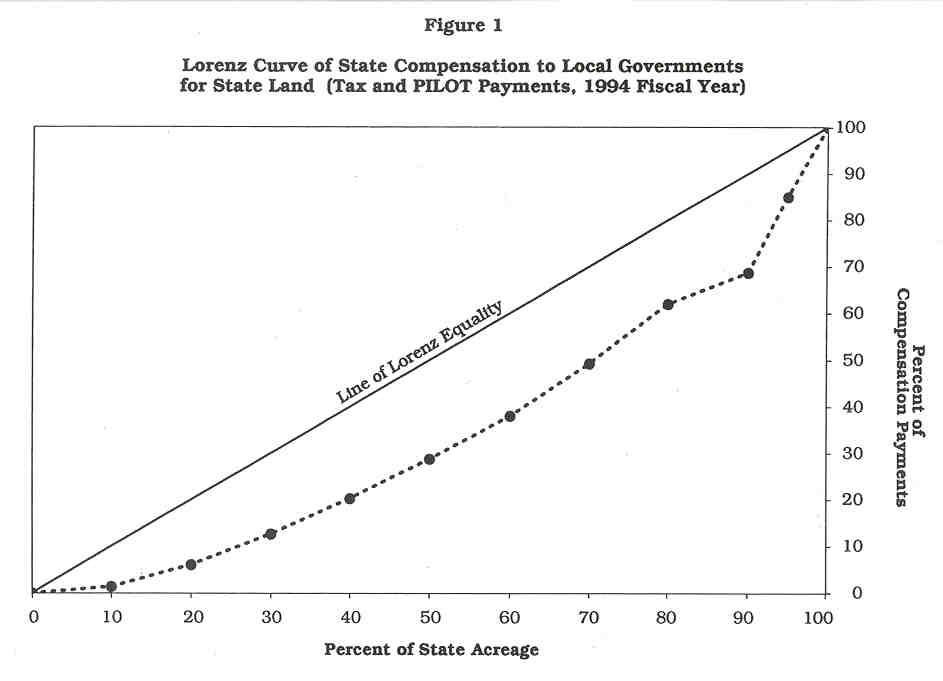
Figure 1 portrays this distributional "inequity" using the technique of Lorenz curve analysis. The diagonal line in the diagram represents a distribution of tax and PILOT payments that would result from a fixed number of dollars per acre of eligible state land paid to each municipality, regardless of whether the land is currently taxable or exempt. In other words, each local government would receive payments exactly in proportion to the acreage of state land within its boundaries: if a municipality had 20 percent of the state's land holdings, it would receive 20 percent of the compensation payments. Because the actual Lorenz curve in Figure 1 departs significantly from the diagonal, it is clear that the existing distribution of payments in New York is not proportional to the state-owned acreage in each community. In fact, those communities whose shares of the total state payments comprise the lowest 40 percent have fully 60 percent of the state's total acreage. And, those communities whose shares of the total compensation together constitute 70 percent of total payments have about 90 percent of the state's land. This pattern is a direct result of the uneven payments distribution shown in Table 9, with per-acre payments in some areas very low, and per-acre payments in others very high.
Whether this observed distribution of payments is thought "equitable" or not depends on the observer's viewpoint. If strict equity means that all communities should receive the same payment per acre, then the existing arrangement is obviously not equitable. If equity means that no local government should be denied compensation for eligible land, the current system fails insofar as some properties are not taxable for all purposes, and some communities have exempt land that would be taxable were it located elsewhere.
Another concept of distributional equity might be payments equaling or in proportion to the taxes "avoided" by the state if its properties were exempt. Under this concept, some of the most extreme differences in per-acre compensation can be explained and 'justified." Certain communities where land is very valuable, with some in the metropolitan New York City area providing the most extreme examples, are clearly receiving the highest per-acre compensation levels under the current programs (sometimes hundreds of dollars per acre), although other local governments in the same region receive no payments if their state properties are not included under one of the tax or PILOT programs. Examples of local government units in the latter category are those Nassau County and Suffolk County municipalities containing the large and tax-exempt Jones Beach and Robert Moses State Park properties. The state's most rural areas -- where both land values and local tax rates tend to be low -- are receiving only a few dollars per acre on average because the 'avoided taxes" are thus similarly low (Table 9).
Yet another concept of equity might require payments based on "need" criteria, such as local income levels, wealth, population, or other such measures. Several state aid programs use such measures of local need as distribution criteria, e.g., education aid, revenue sharing, and emergency financial aid to certain cities. However, it is unclear which, if any, need measures would be relevant in the current context, as the orientation of all the existing programs appears to be "compensation" rather than "assistance." Therefore, no measures of local need are included in the recommendations discussed in Part IV of this report or the fiscal estimates contained in Part V, other than to note that if the state wishes to limit expenditures, one obvious way of doing so would be to set a payment threshold based on acreage of state land or the percentage it represents of the local government's jurisdictional area.
Compensation could also be paid in proportion to the amount of local services provided to state property. As indicated in Part 11, there is precedent for this concept both in New York's existing programs and in the compensation practices used in other states. However, for most state property such as forest lands and parks, the "benefits received" concept can not be investigated due to the lack of a measurable relationship between various local services and these state parcels. While it is known that relatively few local government services benefit most of the parcels in question directly (e.g., the millions of forest preserve acres), no comprehensive local government expenditure data are available to document this. However, data are available on the service charges currently levied on those state properties for which a benefit relationship has been established under existing statutes. These payments are discussed below.
Service charge programs
As shown in Table 10, seventeen local governments received payments for benefit assessments under Section 19 of the Public Lands Law in fiscal 1994. These payments represent capital charges associated with installing such facilities as water and sewer systems that benefit the state properties in question. The payments totaled approximately $2.75 million, or an average of about $160,000 per municipality. Nearly all the municipalities receiving payments were towns, with only one village and no cities represented (the City of Cortland did however receive payments in the prior year). The relatively large payments received by only four municipalities accounted for virtually the entire $2.75 million paid. These included the Town of New Windsor (Stewart Airport; $1.1 million), the Town of Amherst (SUNY; $0.7 million), the Town of Marcy (SUNY, prison, psychiatric center; $0.66 million), and the Town of Babylon (SUNY; $0.3 million).
The most remarkable aspect of the data in Table 10 is that so relatively few municipalities appear to be taking advantage of the opportunity they have to bill the state through the benefit assessment mechanism. The most likely explanation for this is that most municipalities levy user charges instead of benefit assessments. Charges of this latter type are billed directly to the various state facilities and administrative offices receiving water or sewer service. No figures are available for the total amount of user charges paid however, as these fees are not separately budgeted at the state level but are instead included in the budgets of the individual facilities and agencies.
Top of page | Table of contents | Next page