Exemptions from Real Property Taxation in New York State: 2022 County, City, and Town Assessment Rolls
Introduction
All real property in New York is subject to taxation unless specific legal provisions grant it exempt status, whereas personal property is not subject to taxation. Real property tax exemptions are granted on the basis of many different criteria, including the use to which the property is put, the owner's ability to pay taxes, the desire of the state and local governments to encourage certain economic or social activities, and other such considerations.1 Certain exemptions provide full relief from taxation (wholly exempt property) and others reduce the taxes which would otherwise be payable by varying degrees (partially exempt property). Some exemptions apply to taxes levied for county, city/town, and school purposes, whereas others pertain only to some of these purposes. Yet another difference involves the extent of local government autonomy: while some exemptions are mandated by state law, others are subject to local option and/or local determination of eligibility criteria.
This report presents exemption data for 2022 assessment rolls prepared by local assessors throughout New York.2 It covers town, city, and county (Tompkins and Nassau Counties) assessment rolls only; village rolls are not included.
Ultimately, the accuracy of the figures presented depends on the accuracy of the data submitted on the rolls. Although the overwhelming majority of reported exemptions could be related to specific legal provisions through the standardized reporting system provided by NYS Department of Taxation and Finance, Office of Real Property Tax Services (ORPTS), a very small percentage could not be classified because incorrect codes were used, and are thus omitted from certain tables in this report. Similarly, any errors made by assessors in determining the value of a parcel, or the extent to which this value is exempt from taxation, will appear in the data contained herein. Also, experience has shown that some assessors may not keep the values placed on wholly exempt property fully up to date, as valuation of such property has, for the most part, no effect on local tax revenue. Incorrect assessed values may overstate or understate the effect of exemptions on local tax bases.
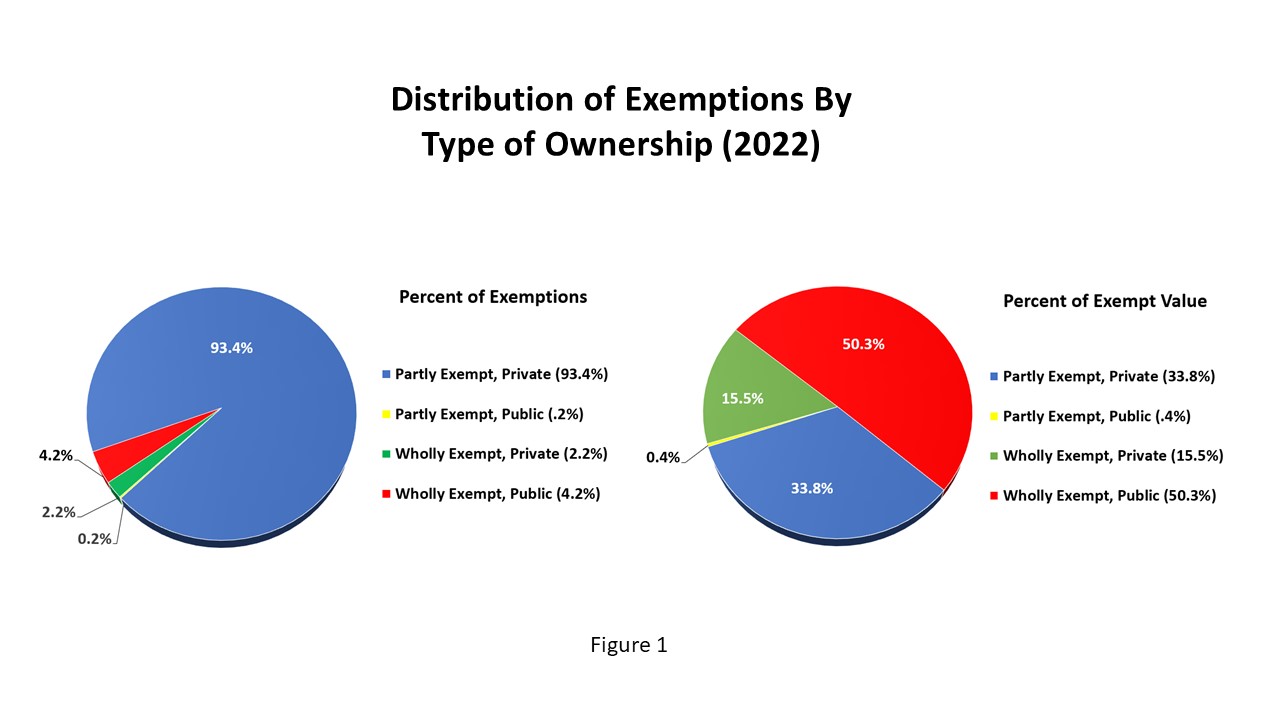
The remainder of the report presents a summary of the 2022 statewide statistics on exempt property in graphic and tabular format, followed by Appendix A, which contains a list of abbreviations and definitions for terms used in the detailed tables that comprise Appendix B.
Table 1. Real Property tax exemptions by property group, 2022 assessment rolls
Table 1. Real Property tax exemptions, 2022 rolls
Group
Number of exemptions
Equalized Exempt Value ($000)
A.
Residential Property other than Multiple Dwellings Non-Residential Property Owned by Certain Individuals
3,118,159
252,437,105
B.
Property of New York State Government and Agencies
21,536
126,616,320
C.
Property of Municipal Governments and Agencies, School Districts, BOCES, and Special Districts
114,239
243,519,385
D.
Property of U.S. and Foreign Governments and Agencies, International or Interstate Agencies, and Indian Tribes
4,828
64,702,202
E.
Property of Private Community Service Organizations, Social Organizations, and Professional Societies
71,628
143,831,490
F.
Industrial, Commercial, and Public Service Property
19,980
81,972,758
G.
Urban Renewal Property, Public Housing, and Private Subsidized Housing (Multiple Dwellings)
99,149
107,584,626
H.
Agricultural and Forest Properties
115,654
12,227,096
Total, Valid Exemption Codes
3,565,173
1,032,890,982
Invalid Codes
3,794
1,554,593
TOTAL
3,568,967
1,034,445,575
Table 2. Exemptions for county purposes: Geographic areas with highest and lowest incidence of exempt value, 2022 assessment rolls
A. Ten with highest incidence
A. Ten with highest incidence
Rank
County
Pct. local-option*
City
Pct. local-option*
Town
Pct. local-option*
1
Tompkins
39.15%
Salamanca (Cat.)
68.59%
Scriba (Osw.)
84.22%
2
Seneca
36.90%
Rensselaer (Ren.)
66.79%
Alfred (All.)
78.73%
3
Oswego
36.69%
Albany (Alb.)
63.74%
Clinton (Cli.)
75.49%
4
St Lawrence
35.96%
Ithaca (Tom.)
58.92%
Blenheim (Scho.)
75.14%
5
Oneida
33.69%
Ogdensburg (St. L)
57.39%
Romulus (Sen.)
74.11%
6
Albany
33.29%
Geneva (Ont.)
56.06%
Ashford (Cat.)
73.26%
7
Nassau
32.36%
Syracuse (Ono.)
52.41%
Marcy (One.)
72.32%
8
Wyoming
32.23%
Peekskill (Wes.)
49.34%
Chateaugay (Fra.)
70.72%
9
Allegany
31.47%
Oneonta (Ots.)
46.97%
Massena (St. L)
68.70%
10
Niagara
31.45%
Little Falls (Her.)
46.21%
Verona (One.)
68.19%
B. Ten with lowest incidence
B. Ten with lowest incidence
Rank
County
Pct. local-option*
City
Pct. local-option*
Town
Pct. local-option*
1
Hamilton
8.31%
Mechanicville (Sar.)
8.14%
Benson (Ham.)
1.12%
2
Putnam
9.86%
Sherrill (One.)
12.18%
Inlet (Ham.)
2.06%
3
Warren
10.35%
Tonawanda (Eri.)
12.94%
Arietta (Ham.)
2.18%
4
Saratoga
12.32%
Rye (Wes.)
13.21%
Stratford (Ful.)
2.89%
5
Washington
13.33%
Lockport (Nia.)
13.90%
Dresden (Was.)
3.06%
6
Ulster
14.09%
North Tonawanda (Nia.)
15.42%
Bolton (War.)
3.14%
7
Columbia
14.37%
Beacon (Dut.)
15.79%
Hope (Ham.)
3.16%
8
Rockland
15.77%
Saratoga Springs (Sar.)
17.22%
Bleecker (Ful.)
3.24%
9
Fulton
15.89%
Port Jervis (Ora.)
19.74%
Horicon (War.)
3.29%
10
Delaware
16.26%
Lackawanna (Eri.)
20.45%
Ellicottville (Cat.)
3.34%
Table 3. Exemptions for county purposes: Counties ranked by percent of full value exempt, 2022 assessment rolls*
Table 3. Exemptions for county purposes: Counties ranked by percent of full value exempt, 2022 rolls*
Rank
County
No. of exemptions
Exempt value ($000)
Pct. of value exempt
1.
Tompkins
6,899
5,971,442
39.15%
2.
Seneca
4,979
1,653,131
36.90%
3.
Oswego
10,450
4,107,842
36.69%
4.
St Lawrence
12,748
3,808,265
35.96%
5.
Oneida
21,703
7,515,015
33.69%
6.
Albany
19,919
15,731,371
33.29%
7.
Nassau
463,405
122,843,486
32.36%
8.
Wyoming
6,977
1,389,983
32.23%
9.
Allegany
7,345
1,184,404
31.47%
10.
Niagara
19,105
7,369,725
31.45%
11.
Schoharie
5,132
1,314,724
30.81%
12.
Cattaraugus
10,776
2,100,158
28.18%
13.
Jefferson
11,583
3,486,425
27.64%
14.
Tioga
5,095
1,130,141
26.69%
15.
Rensselaer
12,371
4,954,724
26.46%
16.
Yates
4,605
1,150,711
26.44%
17.
Broome
14,289
4,144,458
26.38%
18.
Montgomery
6,210
1,068,945
25.80%
19.
Franklin
5,212
1,492,440
24.78%
20.
Onondaga
36,750
11,364,538
24.33%
21.
Livingston
7,496
1,526,942
24.26%
22.
Genesee
8,265
1,200,487
24.01%
23.
Chautauqua
16,099
2,815,751
23.98%
24.
Clinton
9,278
1,905,120
23.81%
25.
Lewis
5,159
763,649
23.38%
26.
Steuben
14,143
2,102,152
23.15%
27.
Orleans
5,578
667,891
22.83%
28.
Cayuga
9,607
1,756,652
22.70%
29.
Sullivan
8,833
3,188,304
22.55%
30.
Schenectady
10,306
3,599,417
22.31%
31.
Madison
8,627
1,429,682
22.05%
32.
Cortland
5,149
820,797
21.87%
33.
Westchester
31,636
58,548,728
21.83%
34.
Ontario
10,745
3,087,806
20.82%
35.
Otsego
6,928
1,403,864
20.76%
36.
Chenango
6,174
749,971
20.15%
37.
Chemung
6,920
1,336,902
19.89%
38.
Suffolk
115,728
101,377,541
19.86%
39.
Dutchess
19,087
9,940,716
19.78%
40.
Herkimer
6,640
1,325,494
19.32%
41.
Wayne
9,626
1,603,690
19.05%
42.
Erie
74,720
19,602,325
18.91%
43.
Greene
5,124
1,890,363
18.53%
44.
Orange
24,262
10,221,569
18.37%
45.
Schuyler
3,366
427,190
18.14%
46.
Monroe
48,426
12,492,033
18.00%
47.
Essex
5,356
1,729,383
17.94%
48.
Delaware
5,235
1,345,049
16.26%
49.
Fulton
5,090
830,264
15.89%
50.
Rockland
15,017
9,114,472
15.77%
51.
Columbia
7,467
1,915,548
14.37%
52.
Ulster
14,602
4,358,836
14.09%
53.
Washington
8,257
923,598
13.33%
54.
Saratoga
15,116
4,623,087
12.32%
55.
Warren
6,565
1,551,617
10.35%
56.
Putnam
6,386
1,855,436
9.86%
57.
Hamilton
885
286,068
8.31%
*Excludes New York City boroughs; New York City data included in Table 4
Table 4. Exemptions for county purposes: Cities ranked by percent of full value exempt, 2022 assessment rolls
Table 4. Exemptions for county purposes: Cities ranked by percent of full value exempt, 2022 rolls
Rank
City
No. of exemptions
Exempt value ($000)
Pct. of value exempt
1.
Salamanca
1,452
239,768
68.59%
2.
Rensselaer
485
1,124,443
66.79%
3.
Albany
6,292
10,753,754
63.74%
4.
Ithaca
829
3,498,195
58.92%
5.
Ogdensburg
850
403,690
57.39%
6.
Geneva
776
700,315
56.06%
7.
Syracuse
7,064
6,383,592
52.41%
8.
Peekskill
740
2,415,069
49.34%
9.
Oneonta
529
476,569
46.97%
10.
Little Falls
334
174,321
46.21%
11.
Watervliet
371
419,551
46.15%
12.
Rome
2,903
1,320,884
45.95%
13.
Troy
1,997
2,012,557
45.86%
14.
Niagara Falls
3,925
1,742,514
45.77%
15.
Jamestown
2,149
497,812
39.36%
16.
Elmira
1,566
498,222
38.35%
17.
Schenectady
3,617
1,792,805
37.67%
18.
Yonkers
5,368
14,030,621
36.71%
19.
Oswego
953
531,458
36.30%
20.
Cortland
790
365,526
36.10%
21.
Utica
3,807
1,276,567
35.68%
22.
Canandaigua
547
458,284
35.06%
23.
Norwich
347
140,046
34.91%
24.
Binghamton
2,374
948,522
34.71%
25.
Olean
1,160
300,667
34.69%
26.
Watertown
1,578
602,705
32.32%
27.
Plattsburgh
1,133
502,069
31.48%
28.
White Plains
1,267
4,939,621
30.89%
29.
Glen Cove
7,670
1,887,227
30.34%
30.
Amsterdam
1,282
286,579
30.24%
31.
Auburn
1,686
537,178
30.01%
32.
Poughkeepsie
1,087
952,948
29.87%
33.
Johnstown
550
235,736
29.63%
34.
Oneida
1,141
240,446
29.20%
35.
Buffalo
19,241
6,285,321
28.99%
36.
Dunkirk
1,068
188,532
28.94%
37.
Rochester
10,065
3,308,722
28.54%
38.
Newburgh
844
590,389
28.02%
39.
New Rochelle
1,850
4,532,439
27.39%
40.
Hudson
448
323,586
27.21%
41.
New York City
624,264
441,853,666
25.78%
42.
Long Beach
9,366
2,082,292
25.74%
43.
Mt Vernon
1,350
2,522,240
25.70%
44.
Kingston
1,412
821,338
25.69%
45.
Hornell
741
109,434
25.47%
46.
Gloversville
977
145,721
25.27%
47.
Corning
763
248,279
25.22%
48.
Fulton
767
140,847
23.95%
49.
Batavia
1,056
230,726
23.81%
50.
Glens Falls
966
401,555
23.65%
51.
Cohoes
881
324,150
22.80%
52.
Middletown
1,051
554,303
21.27%
53.
Lackawanna
1,459
215,806
20.45%
54.
Port Jervis
511
141,102
19.74%
55.
Saratoga Springs
1,193
1,266,044
17.22%
56.
Beacon
667
331,556
15.79%
57.
North Tonawanda
3,044
415,061
15.42%
58.
Lockport
1,234
188,824
13.90%
59.
Rye
442
1,531,150
13.21%
60.
Tonawanda
1,506
140,919
12.94%
61.
Sherrill
57
35,052
12.18%
62.
Mechanicville
218
26,679
8.14%
Table 5. Exemptions for county purposes: Towns with over 50 percent full value exempt, 2022 assessment rolls
Table 5. Exemptions for county purposes: Towns with over 50 percent full value exempt, 2022 rolls
Rank
Town
No. of exemptions
Exempt value ($000)
Pct. of value exempt
1.
Scriba (Osw.)
642
2,372,343
84.22%
2.
Alfred (All.)
312
469,675
78.73%
3.
Clinton (Cli.)
235
180,351
75.49%
4.
Blenheim (Scho.)
141
154,167
75.14%
5.
Romulus (Sen.)
410
746,730
74.11%
6.
Ashford (Cat.)
368
532,936
73.26%
7.
Marcy (One.)
602
1,637,923
72.32%
8.
Chateaugay (Fra.)
431
275,705
70.72%
9.
Massena (St. L)
1,092
1,288,546
68.70%
10.
Verona (One.)
947
906,220
68.19%
11.
Greenwood (Ste.)
283
140,660
66.53%
12.
Lewiston (Nia.)
1,366
3,315,863
66.53%
13.
Dover (Dut.)
519
1,716,948
65.52%
14.
Wethersfield (Wyo.)
320
135,589
64.74%
15.
Le Ray (Jef.)
787
1,062,993
63.72%
16.
Orangeville (Wyo.)
302
196,543
60.92%
17.
Tyre (Sen.)
310
134,072
60.20%
18.
Nichols (Tio.)
264
221,772
59.86%
19.
Arkwright (Cha.)
207
130,614
59.43%
20.
Harrisburg (Lew.)
259
59,073
55.62%
21.
Athens (Gre.)
459
763,820
53.83%
22.
Eaton (Mad.)
656
281,286
53.80%
23.
Martinsburg (Lew.)
433
123,541
53.56%
24.
Eagle (Wyo.)
372
94,821
53.34%
25.
Delhi (Del.)
327
439,707
52.60%
26.
Cherry Creek (Cha.)
246
81,179
52.12%
27.
Sheldon (Wyo.)
602
207,477
52.09%
28.
Fairfield (Her.)
348
122,199
51.30%
29.
Sharon (Scho.)
380
148,379
50.95%
30.
Jasper (Ste.)
405
85,638
50.76%
Table 6. Geographic areas with highest and lowest incidence of local-option exempt value, 2022 assessment rolls
A. Ten with highest incidence
A. Ten with highest incidence
Rank
County
Pct. local-option*
City
Pct. local-option*
Town
Pct. local-option*
1
Fulton
23.17%
Johnstown (Ful.)
40.36%
Ontario (Way.)
61.60%
2
Hamilton
19.63%
Saratoga Springs (Sar.)
27.63%
Shelter Island (Suf.)
50.78%
3
Oswego
18.38%
Auburn (Cay.)
25.85%
Lake Pleasant (Ham.)
45.11%
4
Wayne
17.83%
Lackawanna (Eri.)
19.42%
Chautauqua (Cha.)
43.89%
5
Saratoga
16.14%
Buffalo (Eri.)
17.66%
Watson (Lew.)
40.02%
6
Washington
15.27%
Tonawanda (Eri.)
17.45%
Rhinebeck (Dut.)
39.35%
7
Putnam
14.82%
North Tonawanda (Nia.)
15.34%
Jewett (Gre.)
39.16%
8
Warren
14.30%
Sherrill (One.)
14.44%
Warren (Her.)
35.86%
9
Monroe
14.26%
Hudson (Col.)
14.35%
Madison (Mad.)
35.65%
10
Columbia
14.19%
Newburgh (Ora.)
13.83%
Piercefield (St. L)
33.56%
B. Ten with lowest incidence
B. Ten with lowest incidence
Rank
County
Pct. local-option*
City
Pct. local-option*
Town
Pct. local-option*
1
Tompkins
3.02%
Ithaca (Tom.)
1.51%
Red House (Cat.)
0.00%
2
Wyoming
3.75%
Little Falls (Her.)
2.09%
Alfred (All.
0.47%
3
Yates
4.01%
Albany (Alb.)
2.32%
Blenheim (Scho.)
0.51%
4
Allegany
4.18%
White Plains (Wes.)
2.49%
Delhi (Del.)
0.69%
5
Delaware
4.60%
Rensselaer (Ren.)
2.62%
Clinton (Cli.)
0.70%
6
Seneca
4.66%
Peekskill (Wes.)
2.81%
Harrisburg (Lew.)
0.70%
7
Schoharie
5.26%
Binghamton (Bro.)
2.90%
Romulus (Sen.)
0.77%
8
Schuyler
5.27%
Ogdensburg (St. L)
3.06%
Dover (Dut.)
0.81%
9
St Lawrence
5.41%
Watervliet (Alb.)
3.13%
Bombay (Fra.)
0.82%
10
Franklin
5.51%
Oswego (Osw.)
3.41%
Arkwright (Cha.)
0.83%
*Exempt value of local-option exemptions divided by total exempt value.
*Exempt value of local-option exemptions divided by total exempt value.
Table 7. Exempt value attributable to local option, counties ranked by percent of exempt value, 2022 assessment rolls
Exempt value attributable to local option, counties ranked by percent of exempt value, 2022 rolls
Rank
County
Exempt value local option ($000)
Total exempt value ($000)
Pct. of value exempt
1.
Fulton
311,913
1,346,465
23.17%
2.
Hamilton
68,428
348,673
19.63%
3.
Oswego
939,906
5,113,002
18.38%
4.
Wayne
444,909
2,495,669
17.83%
5.
Saratoga
1,090,746
6,757,753
16.14%
6.
Washington
224,658
1,471,334
15.27%
7.
Putnam
429,168
2,895,032
14.82%
8.
Warren
302,881
2,118,116
14.30%
9.
Monroe
2,556,857
17,924,433
14.26%
10.
Columbia
354,898
2,501,560
14.19%
11.
Erie
3,848,363
27,440,364
14.02%
12.
Ulster
759,975
5,925,683
12.83%
13.
Rockland
1,570,470
12,382,389
12.68%
14.
Onondaga
1,814,822
14,662,691
12.38%
15.
Cayuga
296,409
2,413,952
12.28%
16.
Orange
1,487,766
13,010,672
11.43%
17.
Rensselaer
680,609
6,139,515
11.09%
18.
Dutchess
1,348,887
12,410,826
10.87%
19.
Orleans
110,667
1,042,403
10.62%
20.
Suffolk
12,523,995
119,907,952
10.44%
21.
Nassau
15,338,308
147,168,597
10.42%
22.
Cortland
119,981
1,191,680
10.07%
23.
Chautauqua
390,977
3,954,406
9.89%
24.
Schenectady
459,008
4,746,405
9.67%
25.
Madison
189,714
2,043,701
9.28%
26.
Greene
227,952
2,490,851
9.15%
27.
Broome
511,699
5,747,922
8.90%
28.
Clinton
223,722
2,525,403
8.86%
29.
Essex
172,181
2,055,633
8.38%
30.
Lewis
79,642
1,015,400
7.84%
31.
Livingston
158,021
2,020,913
7.82%
32.
Chenango
93,328
1,196,919
7.80%
33.
Ontario
304,511
4,045,509
7.53%
34.
Otsego
145,695
1,948,468
7.48%
35.
Herkimer
140,912
1,909,577
7.38%
36.
Montgomery
110,600
1,525,512
7.25%
37.
Genesee
123,867
1,720,137
7.20%
38.
Westchester
4,971,397
69,285,321
7.18%
39.
Sullivan
258,858
3,740,701
6.92%
40.
Jefferson
289,769
4,197,535
6.90%
41.
Steuben
202,427
2,933,058
6.90%
42.
Tioga
109,023
1,608,539
6.78%
43.
Oneida
632,230
9,507,769
6.65%
44.
Chemung
135,467
2,056,225
6.59%
45.
Cattaraugus
165,050
2,777,274
5.94%
46.
Niagara
548,478
9,348,858
5.87%
47.
Albany
1,019,630
17,689,394
5.76%
48.
Franklin
104,179
1,889,137
5.51%
49.
St Lawrence
254,961
4,711,221
5.41%
50.
Schuyler
32,257
611,573
5.27%
51.
Schoharie
85,914
1,633,181
5.26%
52.
Seneca
91,418
1,960,828
4.66%
53.
Delaware
83,907
1,825,062
4.60%
54.
Allegany
66,579
1,592,108
4.18%
55.
Yates
54,885
1,369,728
4.01%
56.
Wyoming
65,281
1,739,945
3.75%
57.
Tompkins
196,038
6,498,933
3.02%
Table 8. City/Town distribution of exempt value attributable to local option exemptions: 2022 assessment rolls
Table 8. City/Town distribution of exempt value attributable to local option exemptions: 2022 rolls
Percent of value in local option exemptions
Number of cities/towns
Percent of cities/towns
0 - 9.99
583
58.593%
10 - 19.99
340
34.171%
20 - 29.99
58
5.829%
30 - 39.99
8
0.804%
40 or more
6
0.603%
1 Most exemptions are granted under Article 4 of the Real Property Tax Law, but others are authorized by a wide variety of statutes ranging from the Agriculture and Markets Law to the Transportation Law.
2The material in the report relates to exemptions only. Not covered are the restricted assessments which apply to certain types of property (e.g., condominiums), tax abatement programs, and formerly real property which has been statutorily redefined as personal (non-taxable) property (e.g., certain switching equipment owned by telephone companies). Restricted assessments, tax abatements, and statutory redefinitions, like exemptions, are tax expenditures in that they reduce or shift tax liability.