Assessment Equity in New York: Results from the 2021 Market Value Survey
Introduction
Distributional equity in real property taxation requires that properties of the same value be treated alike in terms of their assessments. New York State law (section 305 of the Real Property Tax Law) stipulates that assessing jurisdictions must assess properties at a uniform percentage of value, and State courts have held that "value" means "market value." New York State's two "special assessing units," New York City and Nassau County, must assess at a uniform percentage of market value within each of four specified property classes. This means that all parcels on the assessment roll (or, for special assessing units, within each class) should have the same, or at least very similar, assessment ratios (assessed value divided by market value). Each assessing unit has the right to choose the percentage of value to be used as an assessment standard.
The New York State Department of Taxation and Finance has statutory responsibility (Section 1200 of the Real Property Tax Law) for regularly monitoring the equity of assessments. An analysis of assessment uniformity is carried out each time the Tax Department's staff completes a market value survey.1 The present report documents findings from the 2021 market value survey.
Included herein is information for the State's 983 non-village assessing units, which consist of 2 counties, 61 cities, and 920 towns.
2021 market value survey data and estimation methodology
For the 2021 market value survey, the level of assessment uniformity for each assessing unit was estimated using one of four possible approaches, as outlined below:
- Sales ratio study: This approach involves a systematic comparison of assessed values to sales prices for properties that have sold. It is used if there is a sufficient sample of sales to provide a reliable estimate of the ratio of assessed value to sales price. The sales prices may be time-adjusted to a common valuation date in order to establish value and assessment ratio as of that date. It is used for residential property only, and supplemented by appraisals for other property types.
- Computer assisted mass appraisal ratio study (CAMA): CAMA involves a systematic comparison of assessed values to market values generated by a statistical model. The model uses a multiple regression equation to predict the market value of residential parcels based on sales data and the physical inventory characteristics of the parcels. The CAMA approach is particularly useful in municipalities with few sales but good parcel inventory data. It is used for residential property only, and is supplemented by appraisals for other property types.
- Stratified sample of parcels using appraisals and or sales: A stratified sample is used where suitable data are available and the sales ratio and/or CAMA approaches are determined to be inappropriate. Direct use of time-adjusted sales in ratio determination is limited to residential property, and sample parcels are weighted based on the incidence of each type on the assessment roll.
- Review and verification of a recent reassessment: The review and verification process is used in assessing units having conducted recent reassessments. It involves an audit-type analysis of the reassessment process and its results to verify that assessments adequately reflect current market conditions. As part of the review, an extensive audit is completed in which the data and analytical processes used to determine the assessments are examined in relation to acceptable professional standards of practice.
Approaches 1 through 3 result in independent computations of the local level of assessment and the assessing units in question are referred to in this report as the "sampled assessing units." Classes of property comprising a very minor portion of the value on the assessment roll may not have been independently valued. The full value of these classes was estimated by applying the overall ratio of the sampled classes. In some cases, appraisals from a prior, recent market value survey may have been reused in the 2021 market value survey.
As mentioned above, assessing units having completed recent reassessments were not sampled, primarily to focus available resources on those with older assessment rolls. These units were handled through the fourth approach, "Review and Verification of a Recent Reassessment," and are referred to as "non-sampled assessing units." A recent reassessment means that the assessing unit has an equitable assessment roll, unless significant errors have been made in the reassessment process, in which case the roll would not have been accepted for review and verification in the survey. Therefore, in the statistical tabulations presented in this report concerning assessment equity, assessing units wherein the review of reassessment procedure was used and the reassessment was deemed acceptable have been counted as meeting equity standards.
It should be understood, however, that the designation of assessing units as having adequate equity does not necessarily imply that all properties in them are accurately assessed. Factors such as uniqueness of certain properties, rapidly changing neighborhood conditions and dynamic market segments in certain time periods, and other such factors, will necessarily mean that there will be inevitable imperfections on the roll, as assessment is not an exact science.
Statistical measurement of assessment uniformity
The primary means of measuring assessment uniformity is a statistic known as the Coefficient of Dispersion (COD). The COD measures the extent to which the assessment ratios from a given roll exhibit dispersion around a midpoint. It is generally accepted that the median assessment ratio best serves as the midpoint or central tendency measure from which the average level of dispersion should be calculated.
Assessing units with good assessing practices have low CODs, showing little deviation of individual assessment ratios from the median ratio. For example, if the median ratio for the parcels sampled in a given assessing unit is 50 percent, a house with a market value of $100,000 should be assessed at $50,000, a commercial property valued at $400,000 should be assessed at $200,000, and a $2,000,000 industrial parcel should be assessed at $1,000,000. If all other sampled parcels were similarly assessed at 50 percent of market value, the median ratio would also be 50 percent and the average deviation, as measured by the COD, would be zero. Conversely, an assessing unit with little assessment uniformity would have widely varying assessment ratios among the sampled parcels, resulting in high dispersion around the median ratio and, therefore, a high COD. Widely varying ratios result in unequal tax bills for properties of equal value.
Examples 1 and 2, below, show two hypothetical assessing units, each attempting to assess properties at 80 percent of market value. In Example 1, the assessed values range from 52 percent to 120 percent of market value, indicating a relatively high level of dispersion and poor assessment practices. Assessments such as these would result in an inequitable distribution of local taxes between property owners.
| Parcel # | Assessed value | Market value | AV/MV ratio | Absolute deviation from median |
|---|---|---|---|---|
| 1. | $120,000 | $100,000 | 1.20 | .40 |
| 2. | $110,000 | $100,000 | 1.10 | .30 |
| Median 3. | $80,000 | $100,000 | .80 | .00 |
| 4. | $58,000 | $100,000 | .58 | .22 |
| 5. | $52,000 | $100,000 | .52 | .28 |
| Total deviation 1.20 | ||||
|
Total deviation No. parcels |
= |
1.20 5 |
= |
.24 average deviation from median |
|
COD = |
Avg. deviation Median ratio |
= |
.24 .80 |
= 30 percent |
Example 2 shows a hypothetical case where assessments are more uniform. The assessment ratios range from 64 percent to 92 percent, and are closer to the target ratio of 80 percent, showing substantially less dispersion than is evident in Example 1. While some dispersion is indeed present, it is significantly lower than in the previous example and within an acceptable range when factors such as measurement error and valuation uncertainty are taken into account.
| Parcel # | Assessed Value | Market Value | AV/MV Ratio | Absolute deviation from median |
|---|---|---|---|---|
| 1. | $92,000 | $100,000 | .92 | .12 |
| 2. | $88,000 | $100,000 | .88 | .08 |
| Median 3. | $80,000 | $100,000 | .80 | .00 |
| 4. | $76,000 | $100,000 | .76 | .04 |
| 5. | $64,000 | $100,000 | .64 | .16 |
| Total deviation .40 | ||||
|
Total deviation No. parcels |
= |
.40 5 |
= |
.08 average deviation from median |
|
COD = |
Avg. deviation Median ratio |
= |
.08 .80 |
= 10 percent |
A second statistical measure of assessment uniformity, called the price-related differential (PRD)2 is also used in the current report for assessing units with no recent reassessment equity. The PRD is used to determine if there is a bias on an assessment roll toward systematic over-assessment of either high- or low-value properties in comparison to the average property. In computing the PRD, the simple mean of the assessment ratios is divided by the value-weighted mean ratio. If no bias exists, the two ratios should be close to each other, and the PRD should be near 1.00. This is referred to as "neutral" assessment practice, that is, no price-related bias. However, if the simple mean ratio is considerably lower than the value-weighted mean, a low PRD results (less than 1.00). In this case, there is said to be a bias toward "progressivity," that is, higher-value properties are being over-assessed and lower-value properties are being under-assessed. In the opposite situation, where the PRD is high (greater than 1.00), "regressive" assessing is evident. In other words, lower-value properties are being relatively over-assessed and higher-value properties are being relatively under-assessed. The International Association of Assessing Officers (IAAO) has established a range for the PRD which denotes uniform practices, that is, neutral assessing: the PRD must fall in the range 0.98 to 1.03 to be considered acceptable.
Coefficient of dispersion standards
Upon the completion of a market value survey, two coefficients of dispersion are calculated for the assessing units with no recent reassessment activity, one for residential property alone and one for all property classes combined. To evaluate the CODs calculated in this process, they must be compared to accepted guidelines for assessment uniformity. The International Association of Assessing Officers, in its publication Standard on Ratio Studies (January 2010), has recognized that the ability of an assessing unit to attain uniformity is affected by several factors, such as the types of property it contains, community size, population density, the degree of diversity of properties, market activity levels, and the relative ages of structures. The IAAO recommends a range of acceptable COD values, based on these categories and neighborhood characteristics, as well as the increased difficulty experienced in assessing classes of property other than residential. IAAO standards are summarized in Table 1.
| Type of property: General | Type of property: Specific | COD range** |
|---|---|---|
| Single-family residential(including residential condominiums) | Newer or more homogenous areas | 5.0 to 10.0 |
| Single-family residential | Older or more heterogeneous areas | 5.0 to 15.0 |
| Other residential | Rural, seasonal, recreational, manufactured housing, 2-4 unit | 5.0 to 20.0 |
| Income-producing properties | Larger areas represented by large sample | 5.0 to 15.0 |
| Income-producing properties | Smaller areas represented by smaller sample | 5.0 to 20.0 |
| Vacant land | — | 5.0 to 25.0 |
| Other real and personal property | — | Varies with local conditions |
| *These types of property are provided for general guidance only and may not represent jurisdictional requirements. **CODs lower than 5.0 may indicate sales chasing or non-representative samples. |
||
In its work with various types of assessing units, the Tax Department's staff has also found that the more rural areas, where there are relatively few sales and properties are more heterogeneous, pose greater difficulty in establishing accurate assessments and market values. Thus, in measuring assessment uniformity, staff has taken the view that somewhat higher COD levels would be acceptable in areas with rural characteristics as contrasted with urban and suburban areas. The guidelines established are summarized in Table 2 and were applied in determining the number of assessing units achieving equity for purposes of this report.
| Population density (persons/sq. mile) | Coefficient of dispersion, all property |
|---|---|
| 100 or less | <20 |
| 101 to 400 | <17 |
| 401 or more | <15 |
Coefficient of dispersion results
For the 2021 market survey, the median residential COD among the sampled assessing units was 17.66, and the median for all property classes combined was 19.50.3 In other words, half the sampled assessing units achieved greater uniformity than indicated by these median values, and half achieved less. The range in the all-property COD was 6.12 to 77.73. For the residential COD, the range among assessing units was 3.77 to 56.92.
The COD results presented herein are point estimates. If the estimation were replicated using an alternative data set, it is likely that somewhat different figures would be obtained due to sampling error. Gloudemans, an expert in the field, has proposed a confidence interval approach to recognize the problem of sampling error. His approach results in a range within which the COD estimate will fall with a known probability. However, the approach does not obviate the need for making point estimates of the COD.4
Table 3 summarizes the 2021 COD information according to type of assessing unit, as measured by population density, and the COD guidelines shown in Table 2. A total of 43 percent of the sampled assessing units had 2021 CODs that reflected uniform assessing practices for the entire roll. In the case of residential property only, 22 percent of the sampled units had uniform rolls.
| Population density (per sq. mi.) | No. of assessing units | Uniform COD level | Percent of assessing units achieving uniform level | ||
|---|---|---|---|---|---|
| Residential | All property | Residential | All property | ||
| <100 | 346 | 15 | 20 | 23% | 40% |
| <100 - <400 | 135 | 12 | 17 | 24% | 47% |
| > 400 | 104 | 10 | 15 | 16% | 51% |
| Total | 585 | — | — | 22% | 43% |
| Note: Data for the individual municipalities within a Coordinated Assessment Program (CAP) are reported. | |||||
Table 4 shows the combined results for sampled and non-sampled assessing units. When the non-sampled units—those for which a recent reassessment program was reviewed and verified—are combined with sampled units achieving satisfactory uniformity, a total of 651 (66.2%) of the state's assessing units had uniform assessment rolls. This represents a decrease in the number of assessing units found to be equitable in the 2020 survey analysis.
| Assessing Unit | Total | Number with uniformity | |
|---|---|---|---|
| Residential | All property | ||
| Sampled | 585 | 128 | 253 |
| Non-Sampled | 398 | 398 | 398 |
| Total | 983 | 526 (53.5%) | 651 (66.2%) |
| *Data for the individual municipalities within a Coordinated Assessment Program (CAP) are reported. | |||
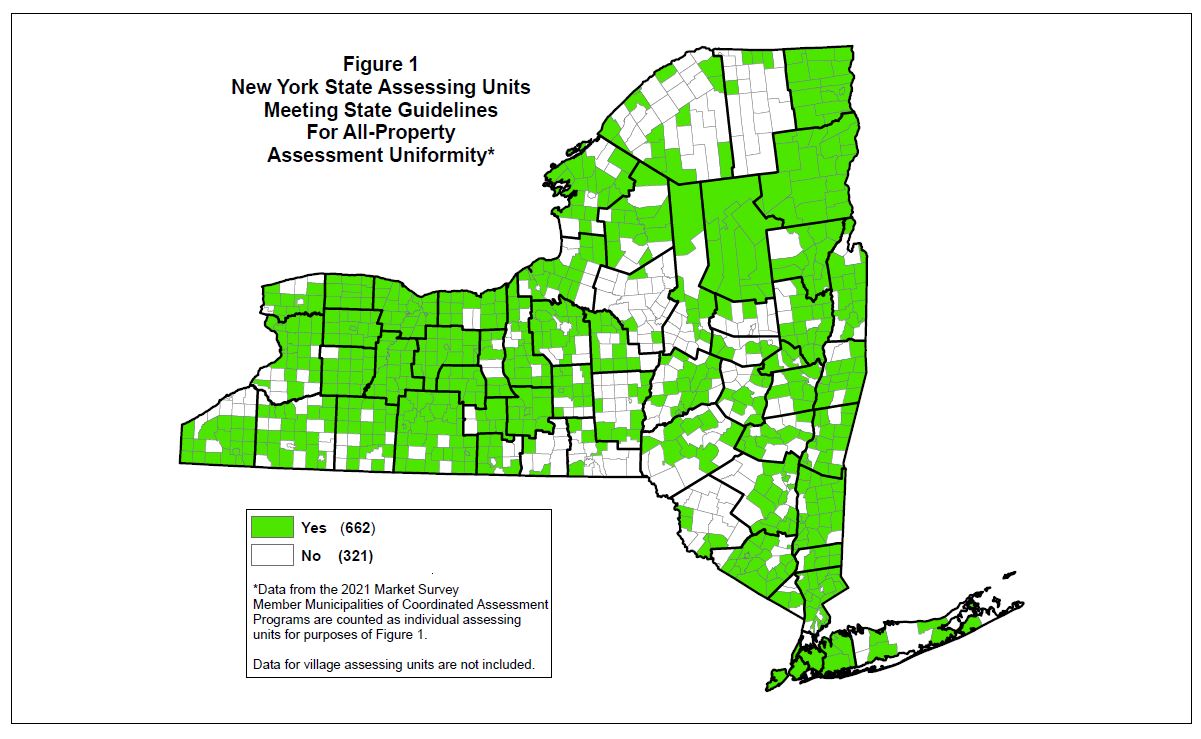
The geographic distribution of equitable assessing is shown in Figure 1. It can be observed that, in many parts of New York State, all or nearly all the municipalities in a county have uniform rolls. On the other hand, clusters of rural assessing units with inequitable rolls are to be found in several areas, including the Northern Catskills, Southern Tier, Adirondacks and Southwestern New York State. Some of the densely populated units in the Lower Hudson Valley and Long Island areas also have not achieved equitable rolls.
Another view of the equity of assessment rolls can be obtained from analysis of the level of assessment reflected on the roll, as contrasted with the degree of uniformity. Table 5 shows the distribution of 2021 equalization rates, which reflect the average percentage of market value used in assessing. The data indicate that nearly 70 percent of all assessing units now have assessments that are at least 75 percent of current market value. Although there are some assessing units with assessments that are well below market value but which are still uniform and equitable, experience has demonstrated that current market assessments are strongly correlated with equity, and the level of assessment findings thus support the Table 4 data on assessment uniformity.
The 80 assessing units having a level of assessment of 25% or less probably have decades-old rolls, that is, no general reassessment program has likely been conducted in a great many years. The additional 54 having a level of assessment in the 25% to 50% range are also very outdated, even in areas of the State with changing real estate markets.
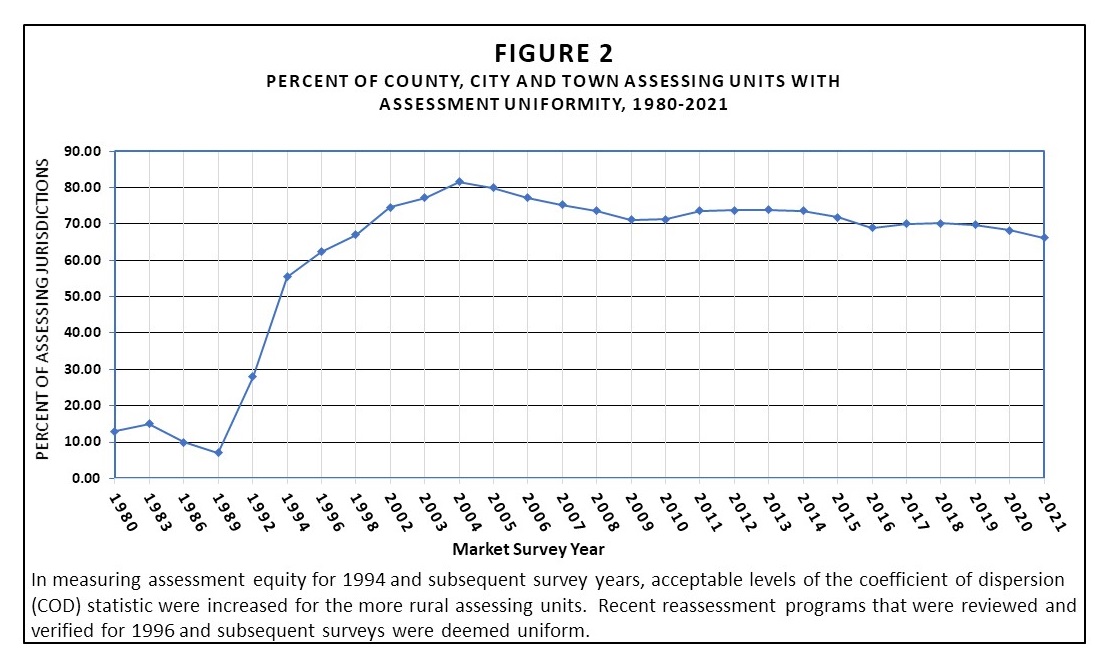
Figure 2 shows the trend in assessment uniformity among New York assessing units since 1980. In the 1980s, only about 10 percent of all assessing units had acceptable uniformity. Dramatic improvement occurred in the early 1990s however, and by 2004, over 80 percent of all assessing units were assessing uniformly. There were modest declines thereafter, in a context of turbulent real estate market conditions in some areas, which persist to the present day. Uniformity has dipped below 70% in recent years.
Price-related differential results
As indicated earlier, another important summary statistic for assessment performance is the price-related differential (PRD). The PRD is calculated by dividing the simple mean assessment ratio by the weighted mean ratio, where the weighted mean is the sum of assessed values divided by the sum of sales prices and/or appraised values. The simple mean counts the ratio of each property equally, regardless of the property's value, whereas the weighted mean counts each ratio differently, weighting ratios of higher-value properties more heavily, in proportion to their dollar value. If no assessment bias exists, the two mean ratios should be equal, producing an index of 1.00. Where there is evidence of a bias in favor of under-assessing the higher-value properties relative to the lower-value ones, the simple mean ratio will be higher than the value-weighted mean ratio, producing an index greater than 1.00 (regressivity). The reverse will be true in cases of over-assessment of high-value properties relative to those of low-value (progressivity). IAAO suggests that the PRD has a value between .98 and 1.03 for neutral assessing.
Table 6 summarizes the extent of value-related equity as measured by the PRD for the sampled assessing units. About 45 percent of the sampled assessing units assessed residential property in a neutral manner, i.e., they generally did not tend to favor either high- or low-value properties. However, 54 percent tended to over-assess low-value homes relative to high-value homes, while only three units tended to do the reverse.
| Price-related differential | Residential class | All property classes | ||
|---|---|---|---|---|
| Number of assessing units | Percent | Number of assessing units | Percent | |
| Progressive | 3 | 1% | 81 | 14% |
| Neutral | 266 | 45% | 227 | 39% |
| Regressive | 316 | 54% | 277 | 47% |
| Total | 585 | 100% | 585 | 100% |
| Note: Data for the individual municipalities within a Coordinated Assessment Program (CAP) are reported. | ||||
When all property classes are combined, the situation changes significantly. Table 6 shows that 14 percent of the sampled assessing units use assessing practices that are biased toward over-assessment of higher-value properties, indicating over-assessment of some non-residential classes (generally industrial, commercial and utility property). About 47 percent demonstrate the opposite behavior, regressive assessing, meaning that they tend to overvalue the lower-priced properties (generally vacant land or low-value residential parcels). The remaining 39 percent of the assessing units assess in a neutral manner with respect to value when all property classes are considered together.
Recent reassessment activity subsequent to the 2021 market survey
As of November 5, 2021, approximately 7 percent (43) of the 585 assessing units for which CODs and PRDs were calculated are conducting or plan to conduct a reassessment on a roll subsequent to the one which was utilized in the 2021 survey.
Of the 398 assessing units for which recent reassessment projects were reviewed for the 2021 market value survey, 171 have scheduled a subsequent reassessment project.
These subsequent reassessments are scheduled to be performed on a roll completed between 2022 and 2023.
1This analysis is required by Section 1200 of the Real Property Tax Law.
2This statistic is sometimes referred to as the Index of Regressivity.
3The special assessing units of New York City and Nassau County are excluded in calculating the median COD because they use a classified assessing system.
4See Robert J. Gloudemans, "Confidence Intervals for the Coefficient of Dispersion: Limitations and Solutions," Assessment Journal, Nov./Dec. 2001.