Exemptions from Real Property Taxation in New York State: 2025 County, City, and Town Assessment Rolls
Introduction
All real property in New York is subject to taxation unless specific legal provisions grant it exempt status, whereas personal property is not subject to taxation. Real property tax exemptions are granted on the basis of many different criteria, including the use to which the property is put, the owner's ability to pay taxes, the desire of the state and local governments to encourage certain economic or social activities, and other such considerations.1 Certain exemptions provide full relief from taxation (wholly exempt property) and others reduce the taxes which would otherwise be payable by varying degrees (partially exempt property). Some exemptions apply to taxes levied for county, city/town, and school purposes, whereas others pertain only to some of these purposes. Yet another difference involves the extent of local government autonomy: while some exemptions are mandated by state law, others are subject to local option and/or local determination of eligibility criteria.
This report presents exemption data for 2025 assessment rolls prepared by local assessors throughout New York.2 It covers town, city, and county (Tompkins and Nassau Counties) assessment rolls only; village rolls are not included.
Ultimately, the accuracy of the figures presented depends on the accuracy of the data submitted on the rolls. Although the overwhelming majority of reported exemptions could be related to specific legal provisions through the standardized reporting system provided by NYS Department of Taxation and Finance, Office of Real Property Tax Services (ORPTS), a very small percentage could not be classified because incorrect codes were used, and are thus omitted from certain tables in this report. Similarly, any errors made by assessors in determining the value of a parcel, or the extent to which this value is exempt from taxation, will appear in the data contained herein. Also, experience has shown that some assessors may not keep the values placed on wholly exempt property fully up to date, as valuation of such property has, for the most part, no effect on local tax revenue. Incorrect assessed values may overstate or understate the effect of exemptions on local tax bases.
The remainder of the report presents a summary of the 2025 statewide statistics on exempt property in graphic and tabular format, followed by Appendix A, which contains a list of abbreviations and definitions for terms used in the detailed tables that comprise Appendix B.
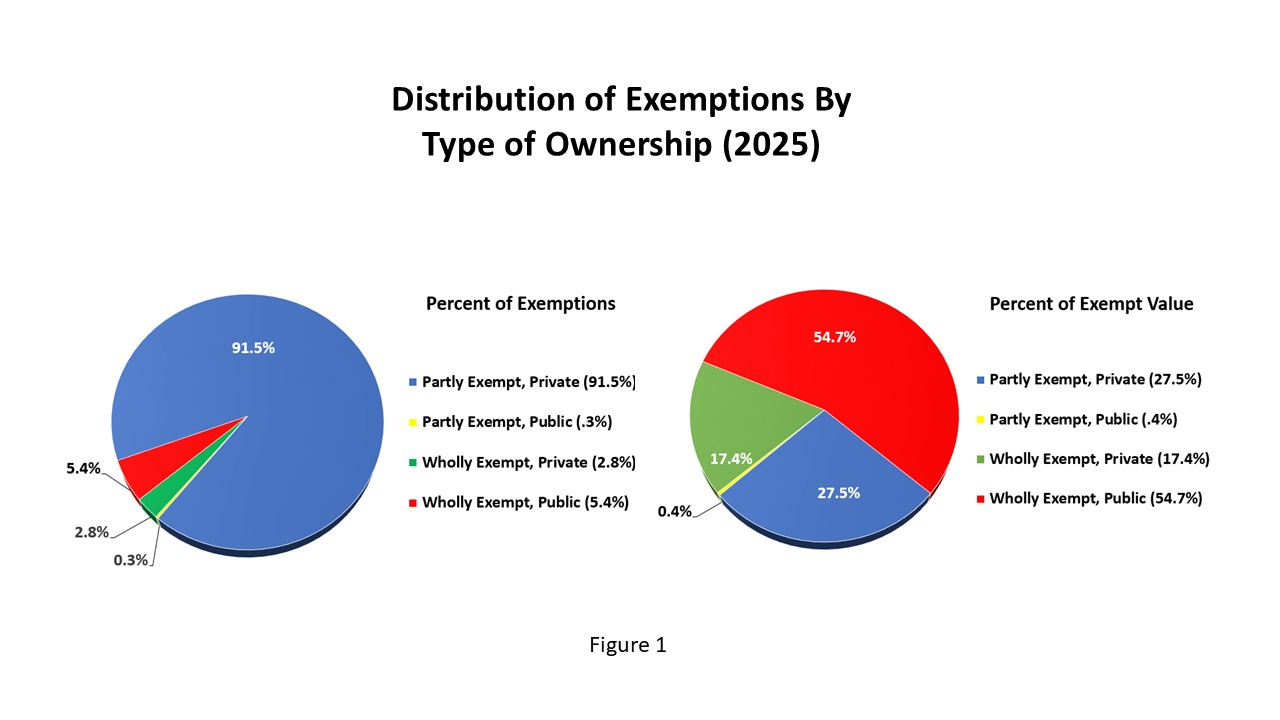
Figure 1: Two pie charts labeled Distribution of Exemptions By Type of Ownership (2025). Pie chart 1 shows the Percent of Exemptions as Partly Exempt, Private (91.5%), Partly Exempt, Public (0.3%), Wholly Exempt, Private (2.8%) and Wholly Exempt, Public (5.4%). Pie chart 2 shows Percent of Exempt Value as Partly Exempt, Private (27.5%), Partly Exempt, Public (0.4%), Wholly Exempt, Private (17.4%) and Wholly Exempt, Public (54.7%).
In recent years, a local option exemption for ad valorem special district taxation purposes has been added. This option applies in connection with RPTL (Real Property Tax Law) 466-a only, that is, Volunteer Firefighters/Ambulance Workers and their Surviving Spouse exemption. The ex_application indication digit for this exemption is '8'. Because of the limited number of this exemption and due to the structure of the current programs utilized to produce the exemption data for this report, the data for year 2025 exemptions for purposes of special district taxation are presented within the report below:
|
(Volunteer Firefighters/Ambulance Worker) Special District Application |
|
| Total Number of Exemptions | 2,674 |
| Total Exempt Assessed Value (in $000) | $49,229 |
| Total Exempt Full Value (in $000) | $105,849 |
| Total Assessed Value of Parcels w/Exemption (in $000) | $518,398 |
| Total Full Value of Parcels w/Exemption (in $000) | $1,105,774 |
Table 1. Real Property tax exemptions by property group, 2025 assessment rolls
| Group | Number of exemptions | Equalized Exempt Value ($000) | |
|---|---|---|---|
| A. | Residential Property other than Multiple Dwellings Non-Residential Property Owned by Certain Individuals | 2,376,323 | 199,188,833 |
| B. | Property of New York State Government and Agencies | 21,659 | 148,708,070 |
| C. | Property of Municipal Governments and Agencies, School Districts, BOCES, and Special Districts | 115,778 | 291,985,169 |
| D. | Property of U.S. and Foreign Governments and Agencies, International or Interstate Agencies, and Indian Tribes | 4,959 | 76,098,708 |
| E. | Property of Private Community Service Organizations, Social Organizations, and Professional Societies | 71,349 | 177,132,282 |
| F. | Industrial, Commercial, and Public Service Property | 18,227 | 99,393,909 |
| G. | Urban Renewal Property, Public Housing, and Private Subsidized Housing (Multiple Dwellings) | 80,768 | 126,217,187 |
| H. | Agricultural and Forest Properties | 116,064 | 16,447,370 |
| Total, Valid Exemption Codes | 2,805,127 | 1,135,171,527 | |
| Invalid Codes | 3,580 | 2,406,995 | |
| TOTAL | 2,808,707 | 1,137,578,523 | |
Table 2. Exemptions for county purposes: Geographic areas with highest and lowest incidence of exempt value, 2025 assessment rolls
| Rank | Counties | Cities | Towns | |||
|---|---|---|---|---|---|---|
| Name | Pct. exempt | Name | Pct. exempt | Name | Pct. exempt | |
| 1. | Tompkins | 37.63% | Salamanca (Cat.) | 69.17% | Scriba (Osw.) | 83.74% |
| 2. | Seneca | 36.96% | Rensselaer (Ren.) | 66.90% | Alfred (All.) | 78.96% |
| 3. | Oswego | 35.66% | Ithaca (Tom.) | 58.01% | Blenheim (Scho.) | 73.93% |
| 4. | St Lawrence | 34.88% | Albany (Alb.) | 55.16% | Romulus (Sen.) | 73.89% |
| 5. | Oneida | 33.18% | Peekskill (Wes.) | 49.31% | Marcy (One.) | 71.80% |
| 6. | Allegany | 31.27% | Syracuse (Ono.) | 48.26% | Greenwood (Ste.) | 70.27% |
| 7. | Niagara | 30.99% | Geneva (Ont.) | 48.03% | Ashford (Cat.) | 69.93% |
| 8. | Schoharie | 30.57% | Oneonta (Ots.) | 47.25% | Massena (St. L.) | 68.58% |
| 9 | Wyoming | 29.10% | Troy (Ren.) | 46.51% | Verona (One.) | 68.31% |
| 10. | Albany | 28.72% | Watervliet (Alb.) | 45.82% | Cohocton (Ste.) | 67.60% |
| Rank | Counties | Cities | Towns | |||
|---|---|---|---|---|---|---|
| Name | Pct. exempt | Name | Pct. exempt | Name | Pct. exempt | |
| 1. | Hamilton | 8.03% | Mechanicville (Sar.) | 8.35% | Benson (Ham.) | 0.90% |
| 2. | Putnam | 9.25% | Tonawanda (Eri.) | 11.39% | Inlet (Ham.) | 1.81% |
| 3. | Warren | 9.53% | Lockport (Nia.) | 11.61% | Arietta (Ham.) | 1.92% |
| 4. | Washington | 11.89% | Sherrill (One.) | 13.19% | Hope (Ham.) | 2.72% |
| 5. | Nassau | 12.02% | Beacon (Dut) | 13.70% | Stratford (Ful.) | 2.79% |
| 6. | Saratoga | 12.33% | Long Beach (Nas.) | 14.26% | Olive (Uls.) | 2.90% |
| 7. | Ulster | 13.51% | Rye (Wes.) | 14.77% | Bolton (War.) | 3.01% |
| 8. | Columbia | 13.71% | North Tonawanda (Nia.) | 15.92% | Dresden (Was.) | 3.08% |
| 9. | Greene | 14.84% | Glen Cove (Nas.) | 17.44% | Ellicottville (Cat.) | 3.13% |
| 10. | Essex | 15.61% | Saratoga Springs (Sar.) | 18.23% | Horicon (War.) | 3.13% |
Table 3. Exemptions for county purposes: Counties ranked by percent of full value exempt, 2025 assessment rolls*
| Rank | County | No. of exemptions | Exempt value ($000) | Pct. of value exempt |
|---|---|---|---|---|
| 1. | Tompkins | 7,019 | 7,003,342 | 37.63% |
| 2. | Seneca | 4,907 | 2,319,320 | 36.96% |
| 3. | Oswego | 10,915 | 5,444,484 | 35.66% |
| 4. | St Lawrence | 12,352 | 4,675,601 | 34.88% |
| 5. | Oneida | 21,117 | 9,856,252 | 33.18% |
| 6. | Allegany | 7,147 | 1,540,519 | 31.27% |
| 7. | Niagara | 18,466 | 9,511,763 | 30.99% |
| 8. | Schoharie | 5,047 | 1,691,605 | 30.57% |
| 9. | Wyoming | 7,103 | 1,519,818 | 29.10% |
| 10. | Albany | 20,853 | 16,290,468 | 28.72% |
| 11. | Jefferson | 11,805 | 4,406,752 | 27.01% |
| 12. | Tioga | 4,869 | 1,443,308 | 26.12% |
| 13. | Cattaraugus | 10,496 | 2,553,256 | 26.06% |
| 14. | Rensselaer | 12,071 | 6,337,043 | 25.53% |
| 15. | Broome | 12,703 | 5,027,557 | 24.98% |
| 16. | Livingston | 7,554 | 2,002,566 | 24.97% |
| 17. | Yates | 4,600 | 1,472,944 | 24.95% |
| 18. | Steuben | 15,133 | 2,891,754 | 24.78% |
| 19. | Chautauqua | 16,334 | 3,932,207 | 24.44% |
| 20. | Montgomery | 6,283 | 1,370,740 | 24.06% |
| 21. | Lewis | 5,196 | 1,051,262 | 23.83% |
| 22. | Cayuga | 10,039 | 2,424,498 | 22.53% |
| 23. | Onondaga | 37,852 | 14,241,522 | 22.20% |
| 24. | Sullivan | 8,215 | 4,808,459 | 22.18% |
| 25. | Genesee | 8,191 | 1,336,200 | 22.13% |
| 26. | Schenectady | 9,298 | 4,771,670 | 21.89% |
| 27. | Franklin | 5,069 | 1,713,609 | 21.77% |
| 28. | Cortland | 4,886 | 1,039,635 | 20.94% |
| 29. | Westchester | 32,919 | 65,403,404 | 20.88% |
| 30. | Otsego | 6,667 | 1,805,602 | 20.52% |
| 31. | Madison | 8,342 | 1,766,761 | 20.07% |
| 32. | Suffolk | 118,713 | 132,851,270 | 20.02% |
| 33. | Chenango | 5,968 | 925,798 | 19.69% |
| 34. | Dutchess | 20,511 | 12,537,093 | 19.53% |
| 35. | Clinton | 8,720 | 1,936,563 | 19.53% |
| 36. | Orleans | 5,442 | 693,439 | 19.32% |
| 37. | Herkimer | 6,520 | 1,816,205 | 19.21% |
| 38. | Chemung | 7,117 | 1,517,587 | 18.70% |
| 39. | Wayne | 9,670 | 2,108,597 | 18.23% |
| 40. | Ontario | 10,680 | 3,594,031 | 18.22% |
| 41. | Orange | 24,341 | 13,369,010 | 17.65% |
| 42. | Monroe | 54,501 | 16,903,561 | 17.34% |
| 43. | Schuyler | 3,138 | 558,451 | 17.21% |
| 44. | Erie | 69,100 | 23,259,034 | 17.09% |
| 45. | Delaware | 5,286 | 1,863,392 | 16.34% |
| 46. | Rockland | 15,209 | 12,115,004 | 15.98% |
| 47. | Fulton | 4,938 | 1,114,830 | 15.84% |
| 48. | Essex | 5,270 | 1,976,867 | 15.61% |
| 49. | Greene | 5,544 | 2,100,629 | 14.84% |
| 50. | Columbia | 7,494 | 2,470,584 | 13.71% |
| 51. | Ulster | 14,212 | 5,777,247 | 13.51% |
| 52. | Saratoga | 16,383 | 6,139,399 | 12.33% |
| 53. | Nassau | 109,224 | 90,026,266 | 12.02% |
| 54. | Washington | 7,997 | 1,082,557 | 11.89% |
| 55. | Warren | 6,470 | 1,885,212 | 9.53% |
| 56. | Putnam | 6,591 | 2,186,263 | 9.25% |
| 57. | Hamilton | 825 | 364,174 | 8.03% |
| *Excludes New York City boroughs; New York City data included in Table 4 | ||||
Table 4. Exemptions for county purposes: Cities ranked by percent of full value exempt, 2025 assessment rolls
| Rank | City | No. of exemptions | Exempt value ($000) | Pct. of value exempt |
|---|---|---|---|---|
| 1. | Salamanca | 1,458 | 296,489 | 69.17% |
| 2. | Rensselaer | 426 | 1,471,090 | 66.90% |
| 3. | Ithaca | 848 | 3,929,582 | 58.01% |
| 4. | Albany | 5,824 | 9,599,101 | 55.16% |
| 5. | Peekskill | 882 | 2,770,197 | 49.31% |
| 6. | Syracuse | 6,963 | 7,338,119 | 48.26% |
| 7. | Geneva | 743 | 732,676 | 48.03% |
| 8. | Oneonta | 487 | 626,790 | 47.25% |
| 9. | Troy | 1,857 | 2,720,441 | 46.51% |
| 10. | Watervliet | 342 | 567,278 | 45.82% |
| 11. | Rome | 2,749 | 1,666,109 | 45.40% |
| 12. | Niagara Falls | 3,500 | 2,376,340 | 45.30% |
| 13. | Little Falls | 312 | 223,220 | 44.40% |
| 14. | Ogdensburg | 706 | 320,851 | 43.98% |
| 15. | Jamestown | 2,163 | 664,542 | 39.76% |
| 16. | Elmira | 1,576 | 634,024 | 38.94% |
| 17. | Schenectady | 2,965 | 2,424,442 | 36.98% |
| 18. | Olean | 1,071 | 362,900 | 34.95% |
| 19. | Yonkers | 5,389 | 14,541,049 | 34.83% |
| 20. | Norwich | 325 | 168,301 | 34.68% |
| 21. | Binghamton | 2,164 | 1,194,254 | 34.01% |
| 22. | Utica | 3,491 | 1,563,704 | 33.95% |
| 23. | Johnstown | 584 | 370,742 | 33.39% |
| 24. | Cortland | 746 | 447,002 | 33.19% |
| 25. | Watertown | 1,535 | 750,559 | 32.84% |
| 26. | White Plains | 1,206 | 5,943,558 | 31.89% |
| 27. | Oswego | 1,050 | 586,008 | 30.99% |
| 28. | Poughkeepsie | 1,114 | 1,269,714 | 30.37% |
| 29. | Dunkirk | 1,090 | 283,884 | 30.22% |
| 30. | Amsterdam | 1,147 | 415,826 | 29.74% |
| 31. | Auburn | 1,696 | 715,226 | 29.73% |
| 32. | Canandaigua | 552 | 491,440 | 29.56% |
| 33. | Plattsburgh | 1,016 | 577,386 | 29.40% |
| 34. | Oneida | 1,094 | 281,954 | 29.18% |
| 35. | New Rochelle | 1,807 | 5,840,326 | 28.97% |
| 36. | Hornell | 755 | 146,936 | 28.31% |
| 37. | Kingston | 1,337 | 1,247,770 | 25.90% |
| 38. | Hudson | 381 | 379,980 | 25.70% |
| 39. | Gloversville | 875 | 199,785 | 24.91% |
| 40. | Newburgh | 914 | 692,903 | 24.33% |
| 41. | Buffalo | 17,749 | 6,917,958 | 24.09% |
| 42. | Mt Vernon | 1,461 | 2,505,982 | 23.47% |
| 43. | Corning | 840 | 246,414 | 23.16% |
| 44. | Cohoes | 834 | 418,529 | 23.08% |
| 45. | Fulton | 754 | 178,937 | 22.91% |
| 46. | Glens Falls | 904 | 447,403 | 22.73% |
| 47. | Rochester | 10,692 | 3,425,672 | 22.45% |
| 48. | Batavia | 1,015 | 250,149 | 21.88% |
| 49. | Port Jervis | 528 | 240,734 | 21.46% |
| 50. | Middletown | 1,101 | 739,208 | 21.06% |
| 51. | Lackawanna | 1,242 | 320,948 | 21.03% |
| 52. | New York City | 163,086 | 471,160,373 | 20.77% |
| 53. | Saratoga Springs | 1,253 | 1,916,251 | 18.23% |
| 54. | Glen Cove | 641 | 1,254,356 | 17.44% |
| 55. | North Tonawanda | 2,782 | 552,838 | 15.92% |
| 56. | Rye | 429 | 2,131,451 | 14.77% |
| 57. | Long Beach | 2,625 | 1,503,742 | 14.26% |
| 58. | Beacon | 716 | 359,569 | 13.70% |
| 59. | Sherrill | 62 | 46,025 | 13.19% |
| 60. | Lockport | 1,193 | 183,538 | 11.61% |
| 61. | Tonawanda | 1,361 | 179,372 | 11.39% |
| 62. | Mechanicville | 231 | 34,974 | 8.35% |
Table 5. Exemptions for county purposes: Towns with over 50 percent full value exempt, 2025 assessment rolls
| Rank | Town | No. of exemptions | Exempt value ($000) | Pct. of value exempt |
|---|---|---|---|---|
| 1. | Scriba (Osw.) | 614 | 3,236,567 | 83.74% |
| 2. | Alfred (All.) | 323 | 584,971 | 78.96% |
| 3. | Blenheim (Scho.) | 128 | 196,323 | 73.93% |
| 4. | Romulus (Sen.) | 397 | 1,031,353 | 73.89% |
| 5. | Marcy (One.) | 577 | 2,216,254 | 71.80% |
| 6. | Greenwood (Ste.) | 311 | 194,532 | 70.27% |
| 7. | Ashford (Cat.) | 357 | 534,976 | 69.93% |
| 8. | Massena (St. L.) | 1,007 | 1,505,455 | 68.58% |
| 9. | Verona (One.) | 1,028 | 1,189,205 | 68.31% |
| 10. | Cohocton (Ste.) | 711 | 406,901 | 67.60% |
| 11. | Lewiston (Nia.) | 1,301 | 4,405,922 | 66.31% |
| 12. | Dover (Dut.) | 573 | 2,276,871 | 65.42% |
| 13. | Harrisburg (Lew.) | 260 | 104,935 | 61.76% |
| 14. | Tyre (Sen.) | 308 | 195,423 | 60.67% |
| 15. | Le Ray (Jef.) | 814 | 1,072,128 | 60.15% |
| 16. | Arkwright (Cha.) | 205 | 179,306 | 59.43% |
| 17. | Cherry Creek (Cha.) | 257 | 129,320 | 55.45% |
| 18. | Nichols (Tio.) | 261 | 285,875 | 55.29% |
| 19. | Delhi (Del.) | 329 | 678,670 | 52.86% |
| 20. | Mount Morris (Liv.) | 614 | 301,905 | 52.71% |
| 21. | Wethersfield (Wyo.) | 321 | 100,242 | 52.60% |
| 22. | Orangeville (Wyo.) | 312 | 173,012 | 52.42% |
| 23. | Fairfield (Her.) | 348 | 162,294 | 51.48% |
| 24. | Orleans (Jef.) | 361 | 668,185 | 51.47% |
| 25. | Farmersville (Cat.) | 264 | 128,546 | 50.68% |
| 26. | Canton (St. L.) | 859 | 650,276 | 50.21% |
| 27. | Eaton (Mad.) | 636 | 357,790 | 50.12% |
Table 6. Geographic areas with highest and lowest incidence of local-option exempt value, 2025 assessment rolls
| Rank | Counties | Cities | Towns | |||
|---|---|---|---|---|---|---|
| Name | Pct. local-option* | Name | Pct. local-option* | Name | Pct. local-option* | |
| 1. | Fulton | 24.26% | Johnstown (Ful.) | 37.56% | Ontario (Way.) | 62.23% |
| 2. | Hamilton | 20.29% | Saratoga Springs (Sar.) | 31.23% | Shelter Island (Suf.) | 47.42% |
| 3. | Oswego | 20.22% | Auburn (Cay.) | 26.52% | Lake Pleasant (Ham.) | 46.13% |
| 4. | Wayne | 19.84% | Buffalo (Erie.) | 21.64% | Jewett (Gre.) | 45.55% |
| 5. | Monroe | 19.68% | Tonawanda (Erie.) | 19.68% | Chautauqua (Cha.) | 44.95% |
| 6. | Putnam | 19.22% | Rochester (Mon.) | 18.21% | Rhinebeck (Dut.) | 40.48% |
| 7. | Saratoga | 18.31% | Lackawanna (Eri.) | 17.15% | Warren (Her.) | 39.16% |
| 8. | Nassau | 18.18% | Newburgh (Ora.) | 17.00% | Piercefield (St. L.) | 38.10% |
| 9. | Washington | 15.83% | Poughkeepsie (Dut.) | 16.66% | Cornwall (Ora.) | 37.80% |
| 10. | Columbia | 15.75% | Beacon (Dut.) | 14.55% | Fenner (Mad.) | 36.56% |
| Rank | Counties | Cities | Towns | |||
|---|---|---|---|---|---|---|
| Name | Pct. local-option* | Name | Pct. local-option* | Name | Pct. local-option* | |
| 1. | Allegany | 3.42% | Little Falls (Her.) | 1.89% | Red House (Cat.) | 0.00% |
| 2. | Tompkins | 3.81% | Ithaca (Tom.) | 2.28% | Blenheim (Scho.) | 0.25% |
| 3. | Seneca | 3.83% | White Plains (Wes.) | 2.39% | Harrisburg (Lew.) | 0.33% |
| 4. | Wyoming | 3.85% | Binghamton (Bro.) | 2.53% | Romulus (Sen.) | 0.67% |
| 5. | Yates | 4.24% | Rensselaer (Ren.) | 2.55% | Alfred (All.) | 0.69% |
| 6. | Schuyler | 4.34% | Albany (Alb.) | 3.03% | Cherry Creek (Cha.) | 0.87% |
| 7. | Schoharie | 4.91% | Watervliet (Alb.) | 3.16% | Clare (St. L.) | 0.88% |
| 8. | Cattaraugus | 5.07% | Ogdensburg (St. L.) | 3.19% | Orleans (Jef.) | 0.93% |
| 9. | Delaware | 5.10% | Salamanca (Cat.) | 3.74% | Delhi (Del.) | 0.95% |
| 10. | Franklin | 5.13% | Schenectady (Sche.) | 3.78% | Ashford (Cat.) | 0.98% |
| *Exempt value of local-option exemptions divided by total exempt value. | ||||||
Table 7. Exempt value attributable to local option, counties ranked by percent of exempt value, 2025 assessment rolls
| Rank | County | Exempt value local option ($000) | Total exempt value ($000) | Pct. of value exempt |
|---|---|---|---|---|
| 1. | Fulton | 392,566 | 1,618,223 | 24.26% |
| 2. | Hamilton | 87,046 | 429,064 | 20.29% |
| 3. | Oswego | 1,302,654 | 6,441,124 | 20.22% |
| 4. | Wayne | 614,450 | 3,096,661 | 19.84% |
| 5. | Monroe | 4,366,820 | 22,191,696 | 19.68% |
| 6. | Putnam | 606,597 | 3,156,329 | 19.22% |
| 7. | Saratoga | 1,474,784 | 8,052,471 | 18.31% |
| 8. | Nassau | 20,013,766 | 110,112,145 | 18.18% |
| 9. | Washington | 263,849 | 1,667,064 | 15.83% |
| 10. | Columbia | 479,216 | 3,043,035 | 15.75% |
| 11. | Warren | 367,371 | 2,442,673 | 15.04% |
| 12. | Erie | 4,615,653 | 31,281,167 | 14.76% |
| 13. | Onondaga | 2,566,083 | 17,646,833 | 14.54% |
| 14. | Ulster | 1,065,178 | 7,443,608 | 14.31% |
| 15. | Rockland | 2,127,298 | 15,102,773 | 14.09% |
| 16. | Orange | 2,190,705 | 16,133,385 | 13.58% |
| 17. | Cayuga | 424,297 | 3,128,475 | 13.56% |
| 18. | Dutchess | 1,969,774 | 14,942,527 | 13.18% |
| 19. | Greene | 357,219 | 2,718,389 | 13.14% |
| 20. | Essex | 294,401 | 2,327,848 | 12.65% |
| 21. | Cortland | 167,942 | 1,395,720 | 12.03% |
| 22. | Rensselaer | 890,344 | 7,453,782 | 11.94% |
| 23. | Suffolk | 16,892,083 | 149,481,010 | 11.30% |
| 24. | Orleans | 115,154 | 1,057,501 | 10.89% |
| 25. | Chautauqua | 534,114 | 5,091,807 | 10.49% |
| 26. | Clinton | 244,129 | 2,553,454 | 9.56% |
| 27. | Montgomery | 168,868 | 1,836,733 | 9.19% |
| 28. | Livingston | 231,743 | 2,550,454 | 9.09% |
| 29. | Chenango | 120,854 | 1,353,638 | 8.93% |
| 30. | Schenectady | 518,833 | 5,907,267 | 8.78% |
| 31. | Broome | 561,163 | 6,577,894 | 8.53% |
| 32. | Steuben | 316,175 | 3,737,269 | 8.46% |
| 33. | Chemung | 172,951 | 2,201,226 | 7.86% |
| 34. | Albany | 1,422,114 | 18,147,850 | 7.84% |
| 35. | Ontario | 355,301 | 4,545,385 | 7.82% |
| 36. | Genesee | 138,876 | 1,851,776 | 7.50% |
| 37. | Westchester | 5,563,688 | 74,424,135 | 7.48% |
| 38. | Herkimer | 168,524 | 2,406,284 | 7.00% |
| 39. | Oneida | 819,374 | 11,833,650 | 6.92% |
| 40. | Jefferson | 351,228 | 5,100,552 | 6.89% |
| 41. | Madison | 164,054 | 2,395,944 | 6.85% |
| 42. | Lewis | 87,359 | 1,304,631 | 6.70% |
| 43. | Otsego | 154,890 | 2,329,896 | 6.65% |
| 44. | Tioga | 122,030 | 1,918,259 | 6.36% |
| 45. | Sullivan | 338,619 | 5,359,001 | 6.32% |
| 46. | Niagara | 685,973 | 11,438,291 | 6.00% |
| 47. | St Lawrence | 285,737 | 5,544,991 | 5.15% |
| 48. | Franklin | 107,823 | 2,102,460 | 5.13% |
| 49. | Delaware | 118,780 | 2,329,213 | 5.10% |
| 50. | Cattaraugus | 163,498 | 3,223,870 | 5.07% |
| 51. | Schoharie | 97,587 | 1,986,993 | 4.91% |
| 52. | Schuyler | 31,947 | 736,942 | 4.34% |
| 53. | Yates | 71,553 | 1,688,504 | 4.24% |
| 54. | Wyoming | 72,414 | 1,881,392 | 3.85% |
| 55. | Seneca | 101,435 | 2,649,979 | 3.83% |
| 56. | Tompkins | 286,726 | 7,530,230 | 3.81% |
| 57. | Allegany | 67,128 | 1,961,153 | 3.42% |
Table 8. City/Town distribution of exempt value attributable to local option exemptions: 2025 assessment rolls
| Percent of value in local option exemptions | Number of cities/towns | Percent of cities/towns |
|---|---|---|
| 0 - 9.99 | 533 | 53.568% |
| 10 - 19.99 | 333 | 33.467% |
| 20 - 20.99 | 99 | 9.950% |
| 30 - 30.99 | 24 | 2.412% |
| 40 or more | 6 | 0.603% |
1 Most exemptions are granted under Article 4 of the Real Property Tax Law, but others are authorized by a wide variety of statutes ranging from the Agriculture and Markets Law to the Transportation Law.
2The material in the report relates to exemptions only. Not covered are the restricted assessments which apply to certain types of property (e.g., condominiums), tax abatement programs, and formerly real property which has been statutorily redefined as personal (non-taxable) property (e.g., certain switching equipment owned by telephone companies). Restricted assessments, tax abatements, and statutory redefinitions, like exemptions, are tax expenditures in that they reduce or shift tax liability.
| Table of contents | Top of page |