Exemptions from Real Property Taxation in New York State: 2020 County, City, and Town Assessment Rolls
Introduction
All real property in New York is subject to taxation unless specific legal provisions grant it exempt status, whereas personal property is not subject to taxation. Real property tax exemptions are granted on the basis of many different criteria, including the use to which the property is put, the owner's ability to pay taxes, the desire of the state and local governments to encourage certain economic or social activities, and other such considerations.1 Certain exemptions provide full relief from taxation (wholly exempt property) and others reduce the taxes which would otherwise be payable by varying degrees (partially exempt property). Some exemptions apply to taxes levied for county, city/town, and school purposes, whereas others pertain only to some of these purposes. Yet another difference involves the extent of local government autonomy: while some exemptions are mandated by state law, others are subject to local option and/or local determination of eligibility criteria.
This report presents exemption data for 2020 assessment rolls prepared by local assessors throughout New York.2 It covers town, city, and county (Tompkins and Nassau Counties) assessment rolls only; village rolls are not included.
Ultimately, the accuracy of the figures presented depends on the accuracy of the data submitted on the rolls. Although the overwhelming majority of reported exemptions could be related to specific legal provisions through the standardized reporting system provided by NYS Department of Taxation and Finance, Office of Real Property Tax Services (ORPTS), a very small percentage could not be classified because incorrect codes were used, and are thus omitted from certain tables in this report. Similarly, any errors made by assessors in determining the value of a parcel, or the extent to which this value is exempt from taxation, will appear in the data contained herein. Also, experience has shown that some assessors may not keep the values placed on wholly exempt property fully up to date, as valuation of such property has, for the most part, no effect on local tax revenue. Incorrect assessed values may overstate or understate the effect of exemptions on local tax bases.
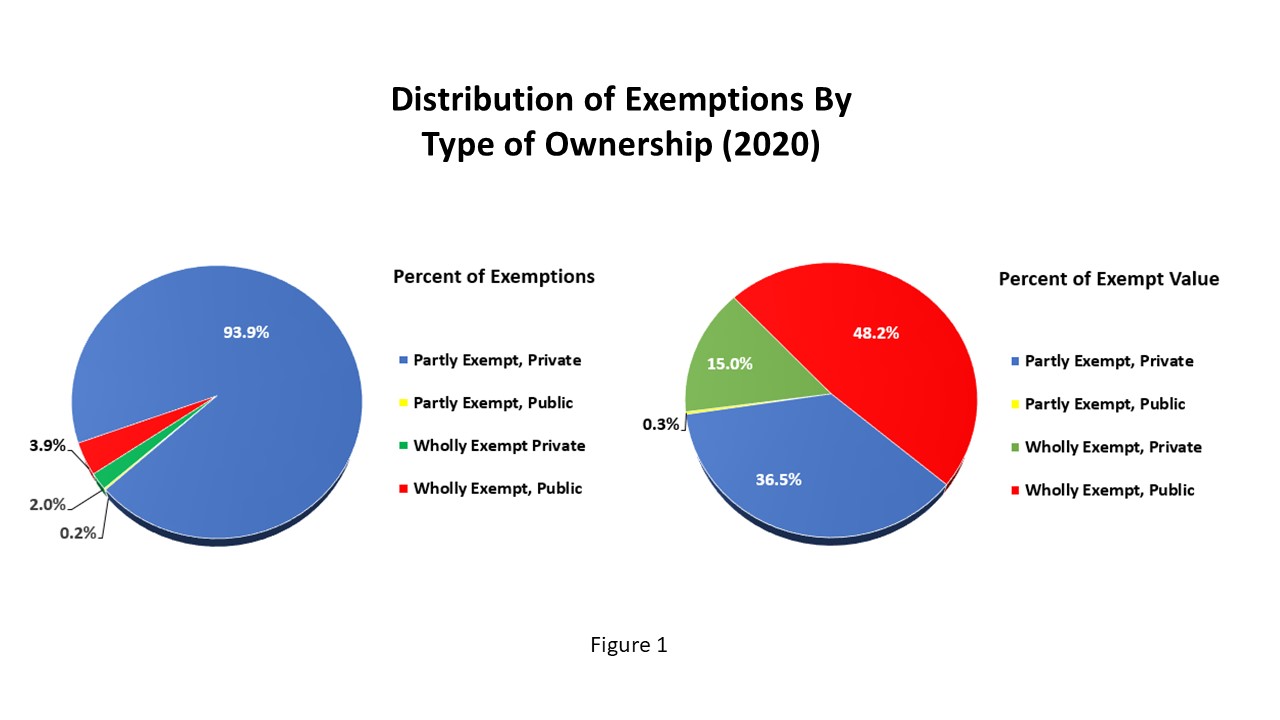
The remainder of the report presents a summary of the 2020 statewide statistics on exempt property, followed by Appendix A which contains a list of abbreviations and definitions for terms used in the detailed tables that comprise Appendix B.
Table 1. Real property tax exemptions by property group, 2020 assessment rolls
Group
Number of exemptions
Equalized Exempt Value ($000)
A.
Residential Property other than Multiple Dwellings Non-Residential Property Owned by Certain Individuals
3,395,299
282,616,860
B.
Property of New York State Government and Agencies
21,438
116,981,823
C.
Property of Municipal Governments and Agencies, School Districts, BOCES, and Special Districts
114,380
244,810,993
D.
Property of U.S. and Foreign Governments and Agencies, International or Interstate Agencies, and Indian Tribes
4,837
65,349,481
E.
Property of Private Community Service Organizations, Social Organizations, and Professional Societies
71,621
142,386,824
F.
Industrial, Commercial, and Public Service Property
21,304
81,469,770
G.
Urban Renewal Property, Public Housing, and Private Subsidized Housing (Multiple Dwellings)
103,873
107,286,502
H.
Agricultural and Forest Properties
115,967
10,550,977
Total, Valid Exemption Codes
3,848,719
1,051,453,230
Invalid Codes
3,739
1,278,141
TOTAL
3,852,458
1,052,731,371
Table 2. Exemptions for county purposes: Geographic areas with highest and lowest incidence of exempt value, 2020 assessment rolls
A. Ten with highest incidence
Rank
Counties
Cities
Towns
Name
Pct. exempt
Name
Pct. exempt
Name
Pct. exempt
1.
Nassau
46.08%
Salamanca (Cat.)
68.07%
Ashford (Cat.)
86.80%
2.
Tompkins
41.04%
Rensselaer (Ren.)
66.55%
Clinton (Cli.)
86.60%
3.
Oswego
38.16%
Albany (Alb.)
63.42%
Scriba (Osw.)
84.74%
4.
Seneca
37.29%
Ithaca (Tom.)
60.52%
Alfred (All.)
79.25%
5.
St Lawrence
36.40%
Geneva (Ont.)
57.48%
Blenheim (Scho.)
74.79%
6.
Schuyler
35.76%
Ogdensburg (St. L)
57.35%
Chateaugay (Fra.)
74.40%
7.
Wyoming
34.86%
Dunkirk (Cha.)
54.54%
Romulus (Sen.)
74.16%
8.
Cattaraugus
34.40%
Syracuse (Ono.)
52.52%
Athens (Gre.)
71.92%
9
Niagara
33.87%
Peekskill (Wes.)
49.53%
Greenwood (Ste.)
71.27%
10.
Oneida
33.54%
Oneonta (Ots.)
47.36%
Marcy (One.)
71.04%
B. Ten with lowest incidence
Rank
Counties
Cities
Towns
Name
Pct. exempt
Name
Pct. exempt
Name
Pct. exempt
1.
Hamilton
8.54%
Mechanicville (Sar.)
8.96%
Benson (Ham.)
1.15%
2.
Putnam
10.53%
Sherrill (One.)
12.18%
Arietta (Ham.)
2.20%
3.
Warren
10.71%
Tonawanda (Eri.)
13.02%
Inlet (Ham.)
2.34%
4.
Saratoga
12.82%
Lockport (Nia.)
15.11%
Stratford (Ful.)
2.83%
5.
Ulster
14.73%
Rye (Wes.)
15.45%
Bolton (War.)
3.19%
6.
Washington
14.90%
North Tonawanda (Nia.)
16.24%
Ellicottville (Cat.)
3.27%
7.
Columbia
15.40%
Saratoga Springs (Sar.)
17.27%
Pittsfield (Ots.)
3.32%
8.
Rockland
15.90%
Beacon (Dut.)
19.54%
Ohio (Her.)
3.39%
9.
Fulton
16.27%
Lackawanna (Eri.)
20.83%
Hope (Ham.)
3.44%
10.
Delaware
16.45%
Port Jervis (Ora.)
21.20%
Bleecker (Ful.)
3.54%
Table 3. Exemptions for county purposes: Counties ranked by percent of full value exempt, 2020 assessment rolls*
Rank
County
No. of exemptions
Exempt value ($000)
Pct. of value exempt
1.
Nassau
430,348
155,671,795
46.08%
2.
Tompkins
6,891
5,871,756
41.04%
3.
Oswego
11,042
3,662,155
38.16%
4.
Seneca
5,080
1,465,564
37.29%
5.
St Lawrence
13,035
3,512,619
36.40%
6.
Schuyler
3,400
883,792
35.76%
7.
Wyoming
7,062
1,350,363
34.86%
8.
Cattaraugus
11,110
2,463,752
34.40%
9.
Niagara
20,110
6,779,741
33.87%
10.
Oneida
22,714
6,326,822
33.54%
11.
Albany
21,177
13,694,808
32.85%
12.
Allegany
7,680
1,056,071
31.62%
13.
Schoharie
5,257
1,071,670
31.11%
14.
Clinton
9,541
2,151,771
28.55%
15.
Jefferson
11,810
3,246,104
28.17%
16.
Rensselaer
13,106
4,528,518
27.79%
17.
Yates
4,728
1,058,339
27.41%
18.
Montgomery
6,468
972,984
27.30%
19.
Greene
5,331
2,357,484
27.12%
20.
Broome
15,161
3,783,271
26.96%
21.
Livingston
7,675
1,362,667
26.17%
22.
Chautauqua
16,604
2,727,327
25.67%
23.
Franklin
5,109
1,355,938
25.56%
24.
Steuben
14,552
2,156,516
25.47%
25.
Genesee
8,448
1,082,797
25.22%
26.
Onondaga
39,594
9,948,984
24.72%
27.
Lewis
5,210
753,089
24.34%
28.
Cayuga
9,788
1,578,975
23.33%
29.
Sullivan
9,472
2,649,241
23.26%
30.
Orleans
5,712
575,182
23.17%
31.
Madison
8,812
1,306,916
22.94%
32.
Tioga
5,254
882,111
22.73%
33.
Schenectady
11,078
3,058,265
22.28%
34.
Westchester
33,786
53,092,366
22.10%
35.
Cortland
5,245
726,859
22.06%
36.
Ontario
11,079
2,759,769
21.42%
37.
Otsego
7,080
1,274,105
21.29%
38.
Chemung
7,135
1,228,848
21.12%
39.
Dutchess
19,841
8,978,984
21.08%
40.
Wayne
9,816
1,425,331
20.08%
41.
Chenango
6,252
634,112
19.88%
42.
Suffolk
119,453
82,232,240
19.77%
43.
Essex
5,600
1,661,507
19.57%
44.
Erie
78,632
17,183,829
19.56%
45.
Herkimer
6,725
1,149,248
19.06%
46.
Orange
25,390
8,645,999
18.62%
47.
Monroe
50,302
10,967,482
18.38%
48.
Delaware
5,297
1,180,490
16.45%
49.
Fulton
5,381
708,936
16.27%
50.
Rockland
16,017
8,162,070
15.90%
51.
Columbia
7,861
1,627,733
15.40%
52.
Washington
8,600
887,417
14.90%
53.
Ulster
15,446
3,542,076
14.73%
54.
Saratoga
15,477
4,193,078
12.82%
55.
Warren
6,992
1,394,038
10.71%
56.
Putnam
6,895
1,770,264
10.53%
57.
Hamilton
921
263,114
8.54%
*Excludes New York City boroughs; New York City data included in Table 4
Table 4. Exemptions for county purposes: Cities ranked by percent of full value exempt, 2020 assessment rolls
Rank
City
No. of exemptions
Exempt value ($000)
Pct. of value exempt
1.
Salamanca
1,459
222,656
68.07%
2.
Rensselaer
553
1,143,763
66.55%
3.
Albany
6,698
9,133,859
63.42%
4.
Ithaca
803
3,414,595
60.52%
5.
Geneva
837
636,530
57.48%
6.
Ogdensburg
917
387,506
57.35%
7.
Dunkirk
1,107
450,421
54.54%
8.
Syracuse
7,880
5,678,105
52.52%
9.
Peekskill
797
2,204,600
49.53%
10.
Oneonta
561
441,212
47.36%
11.
Watervliet
418
379,116
46.54%
12.
Niagara Falls
4,194
1,538,239
46.04%
13.
Troy
2,115
1,691,629
45.91%
14.
Little Falls
342
143,283
45.61%
15.
Rome
3,082
993,553
44.10%
16.
Jamestown
2,207
459,631
39.82%
17.
Schenectady
3,957
1,481,123
38.26%
18.
Glen Cove
6,850
2,158,195
38.19%
19.
Elmira
1,672
417,702
38.07%
20.
Yonkers
5,923
12,495,871
36.79%
21.
Cortland
852
332,589
36.54%
22.
Oswego
1,044
461,448
36.14%
23.
Norwich
382
126,171
35.54%
24.
Utica
3,975
1,012,310
35.30%
25.
Binghamton
2,563
840,624
34.59%
26.
Auburn
1,758
550,440
34.39%
27.
Olean
1,218
286,905
34.29%
28.
Canandaigua
605
394,675
34.20%
29.
Plattsburgh
1,217
497,761
33.26%
30.
Long Beach
8,341
2,320,811
33.00%
31.
Newburgh
897
580,829
32.57%
32.
Poughkeepsie
1,107
854,984
32.44%
33.
Watertown
1,656
553,220
31.79%
34.
White Plains
1,384
4,755,834
30.75%
35.
Amsterdam
1,313
234,105
30.06%
36.
Johnstown
634
201,117
29.29%
37.
Cohoes
977
347,170
29.21%
38.
Buffalo
19,770
5,460,630
28.81%
39.
Oneida
1,179
196,983
28.72%
40.
Hudson
468
276,252
27.96%
41.
New York City
678,596
475,199,144
27.63%
42.
Rochester
10,646
2,879,031
27.58%
43.
Batavia
1,126
222,708
26.57%
44.
New Rochelle
1,976
3,991,047
26.33%
45.
Hornell
790
106,220
26.15%
46.
Kingston
1,528
638,715
26.04%
47.
Corning
826
237,241
25.98%
48.
Fulton
802
119,012
25.72%
49.
Mt Vernon
1,392
2,139,421
25.39%
50.
Glens Falls
1,037
350,395
25.23%
51.
Gloversville
1,069
127,822
25.15%
52.
Middletown
1,112
486,429
21.68%
53.
Port Jervis
567
120,585
21.20%
54.
Lackawanna
1,552
193,603
20.83%
55.
Beacon
715
338,550
19.54%
56.
Saratoga Springs
1,253
1,114,251
17.27%
57.
North Tonawanda
3,257
346,100
16.24%
58.
Rye
477
1,614,556
15.45%
59.
Lockport
1,291
170,563
15.11%
60.
Tonawanda
1,543
119,475
13.02%
61.
Sherrill
57
28,255
12.18%
62.
Mechanicville
233
24,460
8.96%
Table 5. Exemptions for county purposes: Towns with over 50 percent full value exempt, 2020 assessment rolls
Rank
Town
No. of exemptions
Exempt value ($000)
Pct. of value exempt
1.
Ashford (Cat.)
386
1,048,624
86.80%
2.
Clinton (Cli.)
239
314,977
86.60%
3.
Scriba (Osw.)
671
2,128,958
84.74%
4.
Alfred (All.)
314
418,210
79.25%
5.
Blenheim (Scho.)
140
121,158
74.79%
6.
Chateaugay (Fra.)
422
299,586
74.40%
7.
Romulus (Sen.)
410
664,653
74.16%
8.
Athens (Gre.)
507
1,400,962
71.92%
9.
Greenwood (Ste.)
291
134,872
71.27%
10.
Marcy (One.)
637
1,397,316
71.04%
11.
Eagle (Wyo.)
370
173,129
70.96%
12.
Massena (St. L)
1,144
1,184,656
68.55%
13.
Verona (One.)
967
804,175
68.49%
14.
Dix (Schu.)
538
655,956
68.14%
15.
Lewiston (Nia.)
1,414
2,977,080
66.73%
16.
Harrisburg (Lew.)
254
82,186
66.20%
17.
Le Ray (Jef.)
800
1,053,522
66.00%
18.
Wethersfield (Wyo.)
311
115,133
65.04%
19.
Dover (Dut.)
523
1,390,028
64.70%
20.
Tyre (Sen.)
310
127,891
62.16%
21.
Altona (Cli.)
381
181,682
61.65%
22.
Orangeville (Wyo.)
325
166,454
61.02%
23.
Somerset (Nia.)
431
283,081
60.33%
24.
Nichols (Tio.)
281
204,022
59.96%
25.
Arkwright (Cha.)
210
120,238
58.68%
26.
Ellenburg (Cli.)
409
189,864
59.33%
27.
Cohocton (Ste.)
665
181,141
57.95%
28.
Martinsburg (Lew.)
422
125,800
56.32%
29.
Eaton (Mad.)
658
286,851
56.12%
30.
Sheldon (Wyo.)
623
202,532
53.54%
31.
Delhi (Del.)
351
390,149
52.73%
32.
Jasper (Ste.)
407
84,333
52.70%
33.
Fairfield (Her.)
341
109,088
51.42%
34.
Sharon (Scho.)
404
119,035
51.34%
35.
Hamilton (Mad.)
509
306,404
50.54%
36.
Denmark (Lew.)
633
159,294
50.26%
37.
Potter (Yat.)
502
109,299
50.14%
38.
Canton (St. L)
897
433,911
50.08%
Table 6. Geographic areas with highest and lowest incidence of local-option exempt value, 2020 assessment rolls
A. Ten with highest incidence
Rank
Counties
Cities
Towns
Name
Pct. local-option*
Name
Pct. local-option*
Name
Pct. local-option*
1.
Nassau
59.17%
Long Beach (Nas.)
56.44%
North Hempstead (Nas.)
70.03%
2.
Fulton
23.82%
Glen Cove (Nas.)
48.03%
Ontario (Way.)
65.16%
3.
Hamilton
19.14%
Johnstown (Ful.)
43.07%
Oyster Bay (Nas.)
59.82%
4.
Wayne
18.92%
Saratoga Springs (Sar.)
27.58%
Hempstead (Nas.)
54.65%
5.
Oswego
18.47%
Auburn (Cay.)
23.16%
Shelter Island (Suf.)
50.50%
6.
Saratoga
15.25%
Lackawanna (Eri.)
20.76%
Lake Pleasant (Ham.)
44.18%
7.
Putnam
14.93%
Cohoes (Alb.)
18.25%
Chautauqua (Cha.)
42.86%
8.
Washington
14.81%
Buffalo (Eri.)
16.36%
Rhinebeck (Dut.)
39.17%
9.
Columbia
14.68%
Tonawanda (Eri.
16.14%
Watson (Lew.)
38.66%
10.
Monroe
13.94%
North Tonawanda (Nia.)
15.51%
Jewett (Gre.)
37.13%
B. Ten with lowest incidence
Rank
Counties
Cities
Towns
Name
Pct. local-option*
Name
Pct. local-option*
Name
Pct. local-option*
1.
Tompkins
2.70%
Ithaca (Tom.)
1.33%
Red House (Cat.)
0.25%
2.
Schuyler
2.97%
Little Falls (Her.)
1.97%
Clinton (Cli.)
0.37%
3.
Wyoming
4.04%
Geneva (Ont.)
2.12%
Alfred (All.)
0.49%
4.
Yates
4.18%
Albany (Alb.)
2.32%
Harrisburg (Lew.)
0.52%
5.
Allegany
4.29%
White Plains (Wes.)
2.63%
Ashford (Cat.)
0.55%
6.
Delaware
4.67%
Rensselaer (Ren.)
2.71%
Bombay (Fra.)
0.65%
7.
Seneca
4.91%
Peekskill (Wes.)
3.02%
Eagle (Wyo.)
0.67%
8.
Cattaraugus
4.98%
Watervliet (Alb.)
3.42%
Delhi (Del.)
0.70%
9.
Franklin
5.09%
Ogdensburg (St. L)
3.43%
Blenheim (Scho.)
0.76%
10.
St Lawrence
5.36%
Binghamton (Bro.)
3.52%
Romulus (Sen.)
0.76%
*Exempt value of local-option exemptions divided by total exempt value.
Table 7. Exempt value attributable to local option, counties ranked by percent of exempt value, 2020 assessment rolls
Rank
County
Exempt value local option ($000)
Total exempt value ($000)
Pct. of value exempt
1.
Nassau
104,759,328
177,058,841
59.17%
2.
Fulton
285,770
1,199,505
23.82%
3.
Hamilton
63,205
330,291
19.14%
4.
Wayne
440,208
2,326,574
18.92%
5.
Oswego
855,909
4,632,957
18.47%
6.
Saratoga
978,798
6,419,140
15.25%
7.
Putnam
433,187
2,902,186
14.93%
8.
Washington
212,443
1,434,728
14.81%
9.
Columbia
313,645
2,135,851
14.68%
10.
Monroe
2,266,846
16,264,743
13.94%
11.
Warren
268,107
1,961,046
13.67%
12.
Erie
3,325,556
24,644,688
13.49%
13.
Ulster
664,375
4,938,075
13.45%
14.
Onondaga
1,710,227
13,277,554
12.88%
15.
Rockland
1,470,433
11,550,564
12.73%
16.
Cayuga
270,522
2,247,726
12.04%
17.
Orange
1,256,042
11,341,089
11.08%
18.
Rensselaer
625,695
5,689,308
11.00%
19.
Suffolk
10,816,345
99,620,258
10.86%
20.
Dutchess
1,225,938
11,497,517
10.66%
21.
Orleans
96,450
936,990
10.29%
22.
Schenectady
420,990
4,183,713
10.06%
23.
Madison
181,242
1,895,018
9.56%
24.
Chautauqua
364,759
3,863,099
9.44%
25.
Broome
507,323
5,374,700
9.44%
26.
Cortland
94,684
1,087,289
8.71%
27.
Essex
162,195
2,000,659
8.11%
28.
Herkimer
133,880
1,728,323
7.75%
29.
Otsego
138,830
1,795,565
7.73%
30.
Sullivan
241,101
3,183,099
7.57%
31.
Clinton
210,417
2,789,168
7.54%
32.
Montgomery
103,726
1,389,648
7.46%
33.
Livingston
139,442
1,879,619
7.42%
34.
Lewis
75,164
1,014,006
7.41%
35.
Genesee
115,613
1,609,802
7.18%
36.
Ontario
266,790
3,721,949
7.17%
37.
Jefferson
282,301
3,963,492
7.12%
38.
Westchester
4,560,037
64,632,311
7.06%
39.
Chenango
72,989
1,070,859
6.82%
40.
Oneida
559,741
8,231,096
6.80%
41.
Steuben
204,100
3,013,035
6.77%
42.
Albany
1,032,802
15,663,322
6.59%
43.
Greene
188,106
2,897,545
6.49%
44.
Tioga
88,215
1,374,752
6.42%
45.
Chemung
119,937
1,930,375
6.21%
46.
Niagara
508,792
8,731,963
5.83%
47.
Schoharie
74,897
1,370,203
5.47%
48.
St Lawrence
237,098
4,421,190
5.36%
49.
Franklin
89,542
1,759,776
5.09%
50.
Cattaraugus
157,181
3,155,610
4.98%
51.
Seneca
86,965
1,771,551
4.91%
52.
Delaware
77,136
1,651,423
4.67%
53.
Allegany
62,875
1,467,098
4.29%
54.
Yates
53,598
1,283,381
4.18%
55.
Wyoming
69,727
1,724,622
4.04%
56.
Schuyler
31,524
1,062,763
2.97%
57.
Tompkins
173,418
6,430,575
2.70%
Table 8. City/Town distribution of exempt value attributable to local option exemptions: 2020 assessment rolls
Percent of value in local option exemptions
Number of cities/towns
Percent of cities/towns
0 - 9.99
574
57.69%
10 - 19.99
345
34.67%
20 - 29.99
58
5.83%
30 - 39.99
8
0.80%
40 or more
10
1.01%
1 Most exemptions are granted under Article 4 of the Real Property Tax Law, but others are authorized by a wide variety of statutes ranging from the Agriculture and Markets Law to the Transportation Law.
2The material in the report relates to exemptions only. Not covered are the restricted assessments which apply to certain types of property (e.g., condominiums), tax abatement programs, and formerly real property which has been statutorily redefined as personal (non-taxable) property (e.g., certain switching equipment owned by telephone companies). Restricted assessments, tax abatements, and statutory redefinitions, like exemptions, are tax expenditures in that they reduce or shift tax liability.