Personal income tax

More money

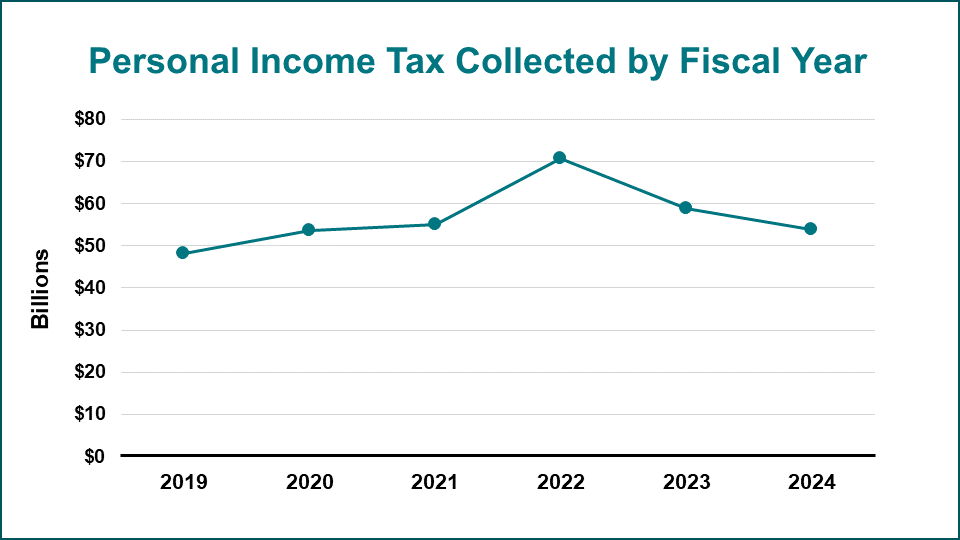
The Tax Department collected more than $67 billion in personal income taxes in 2021. This is the state’s largest revenue source, supporting programs and services including education ($41.2 billion), health ($28 billion), and public safety ($2.8 billion).

chart of personal income tax collected in milIions of dollars

Personal income tax collected in millions of dollars from 2017 to 2021. Upward trend. 2017: approximately $48,720,000; 2018: approximately $49,999,000; 2019: approximately $52,875,000; 2020: approximately $53,140,000; 2021: approximately $67,208,000

Personal income tax collections by year
Calendar year 2017 2018 2019 2020 2021
Personal income tax collections (in millions of dollars) $48,720.0 $49,999.2 $52,874.5 $53,140.4 $67,207.5

Fewer tax filers

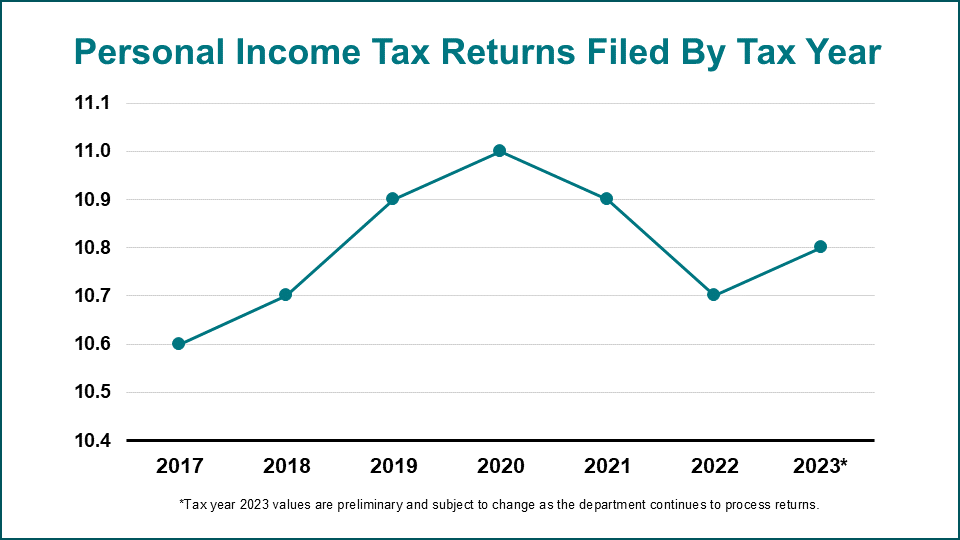
More than 10.8 million individual taxpayers filed personal income taxes in New York in 2021, down from almost 11 million in 2020 when the COVID-19 pandemic hit.

Chart of Personal Income Tax Returns Filed

Personal income tax returns filed from 2017 to 2021; upward trend 2017 through 2020, then quick downturn 2021. 2017: 10,635,350; 2018: 10,728,408; 2019: 10,861,338; 2020: 10,987,142; 2021: 10,816,979

Chart of Population in New York State, 2017 through 2021

Population trending downward from 2017 through 2019; upward trend from 2019 to 2020; trending down from 2020 to 2021. Population is 2017: 19,593,849; 2018: 19,544,098; 2019: 19,463,131; 2020: 20,154,933; 2021: 19,835,913

Returns filed by tax year
Tax year 2017 2018 2019 2020 2021
Number of returns filed 10,635,350 10,728,408 10,861,338 10,987,142 10,816,979
Population 19,593,849 19,544,098 19,463,131 20,154,933 19,835,913

Top state personal income tax rates and brackets as of January 1, 2023 
State Top rate Bracket
California 1,2,3 12.30% $677,275
Hawaii 2 11.00% $200,000
New York 1 10.90% $25,000,000
Dist. Of Columbia 10.75% $1,000,000
New Jersey 10.75% $1,000,000
Oregon 1,2 9.90% $125,000
Minnesota 1,7 9.85% $183,341
Vermont 1,12 8.75% $229,500
Wisconsin 1,13 7.65% $304,170
Maine 1,2 7.15% $58,050
Connecticut 2 6.99% $500,000
Montana 1,2 6.75% $21,600
Nebraska 1,2,14 6.64% $35,730
Delaware 6.60% $60,001
West Virginia 6.50% $60,000
South Carolina 1,14 6.40% $16,040
Iowa 1,14 6.00% $75,000
Rhode Island 1 5.99% $166,950
New Mexico 9 5.90% $210,000
Idaho 5.80% $0
Georgia 4 5.75% $7,001
Maryland 5 5.75% $250,000
Virginia 2 5.75% $17,001
Kansas 2 5.70% $30,000
Alabama 2 5.00% $3,001
Massachusetts 6 5.00% $0
New Hampshire 5% on dividends and interest income only
Mississippi 8 5% above $10,000 only
Illinois 1 4.95% $0
Missouri 1 4.95% $8,449
Arkansas 1 4.90% $8,501
Utah 4.85% $0
North Carolina 4.75% $0
Oklahoma 11 4.75% $7,200
Kentucky 4.50% $0
Colorado 4.40% $0
Lousiana 2,14 4.25% $50,001
Michigan 4.25% $0
Ohio 1 3.99% $115,300
Indiana 3.15% $0
Pennsylvania 3.07% $0
North Dakota 1 ,10 2.90% $491,350
Arizona 2.50% $0
Alaska n/a
Florida n/a
Nevada n/a
South Dakota n/a
Tennessee n/a
Texas n/a
Washington n/a
Wyoming n/a
(1) 16 states have statutory provision for automatically adjusting to the rate of inflation the dollar values of the income tax brackets, standard deductions, and/or personal exemptions. Oregon does not index the income brackets for $125,000 and over.
(2) For joint returns, taxes are twice the tax on half the couple’s income
(3) California imposes an additional 1% tax on taxable income over $1 million, making the maximum rate 13.3% over $1 million. 
(4) The Georgia income brackets reported are for single individuals. For married couples filing jointly, the same tax rates apply to the top income bracket of $10,000
(5) The income brackets reported for Maryland are for single individuals. For married couples filing jointly, the same tax rates apply to the top income bracket of $300,000.
(6) Short-term capital gains in Massachusetts is taxed at 12% rate. An additional tax of 4% on income of $1 million
(7) The income brackets reported for Minnesota are for single individuals. For married couples filing jointly, the same tax rates apply to the top income bracket of $304,971
(8) Mississippi rate decreases in 2024 to 4.8% if net general revenue goal is met.
(9) The income brackets reported for New Mexico are for single individuals. For married couples filing jointly, the same tax rates apply to the top income bracket of $315,000.
(10) The income brackets reported for North Dakota are for single individuals. For married couples filing jointly, the same tax rates apply to the top income bracket of $491,350.
(11) The income brackets reported for Oklahoma are for single persons. For married persons filing jointly, the same tax rates apply to the top income bracket of $12,200.
(12) Vermont’s income brackets reported are for single individuals. For married taxpayers filing jointly, the same tax rates apply to the top income bracket of $279,450.
(13) The Wisconsin income brackets reported are for single individuals. For married taxpayers filing jointly, the same tax rates apply to the top income bracket of $405,550
(14) Louisiana tax rates may be adjusted down if revenue trigger is met on April 1st. Iowa is phasing-in a flat rate by 2027, while Nebraska and South Carolina is phasing-in a reduced top rate by 2027
Source: State Personal Income Tax Rates, 2023 | Federation of Tax Administrators

Progressive tax system

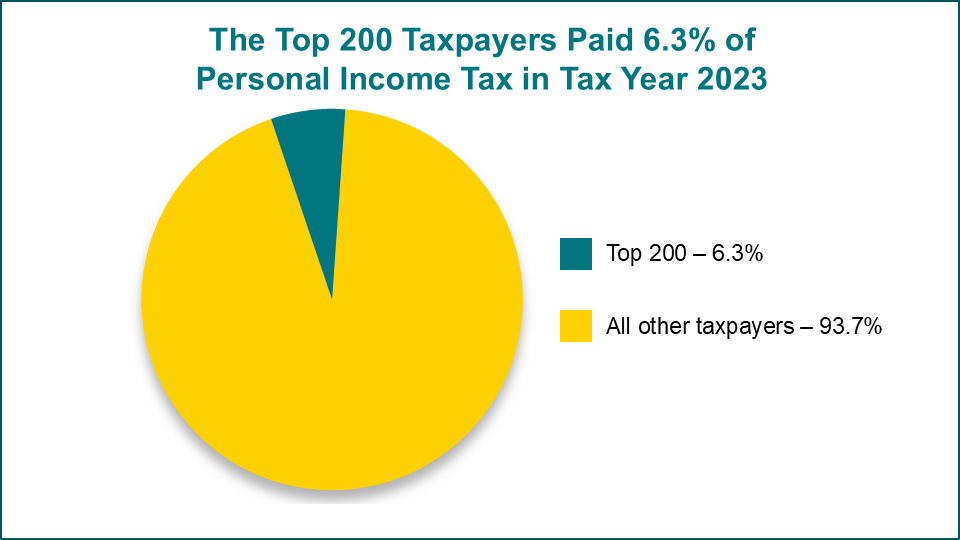
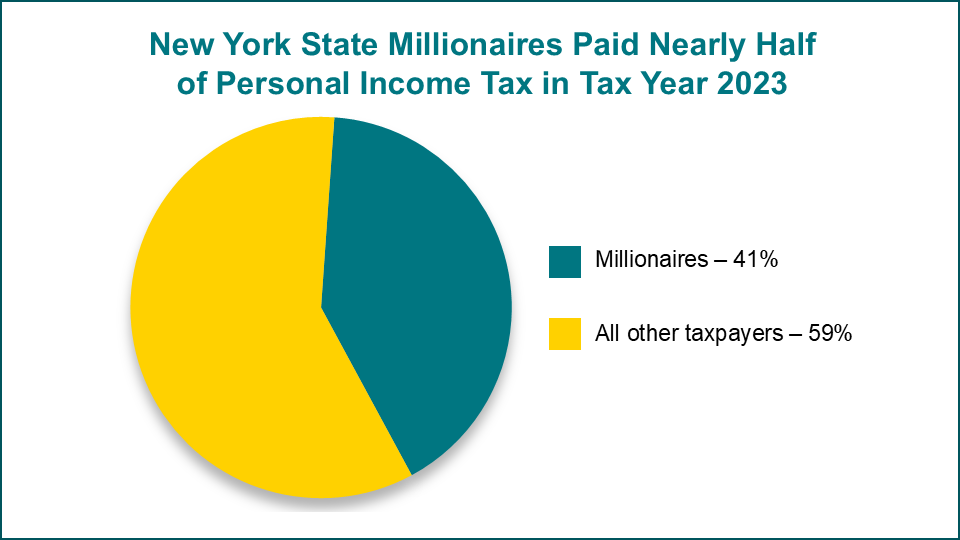
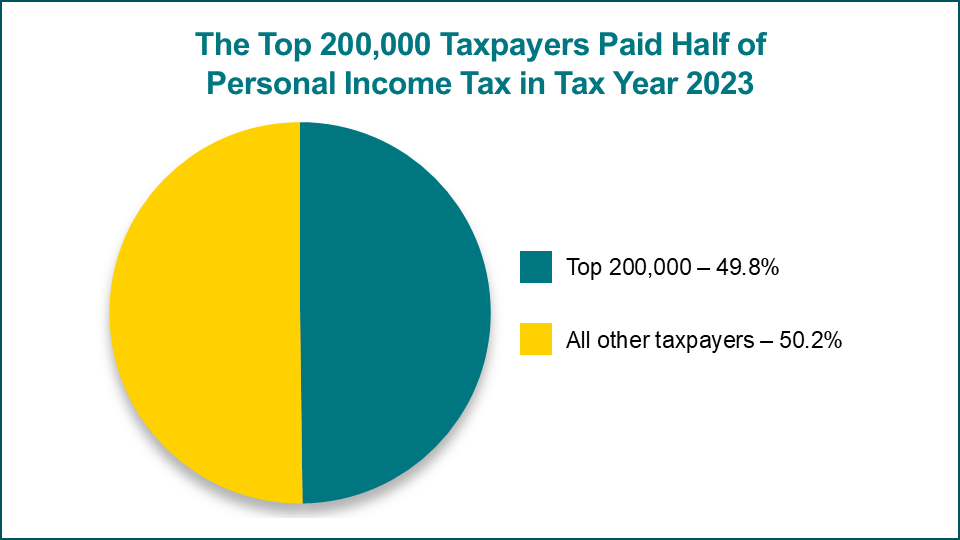
New York State’s progressive tax system imposes a lower tax burden on lower income taxpayers, while nearly half of New York State’s taxes are paid by 84,000 taxpayers with the highest incomes. Millionaires paid as much as 98.9% of all filers.

Pie Graphs of Top 200 Taxpayers Paying Taxes

Top 200: 9.5%; All other taxpayers: 90.5%

Pie Chart of Top 200,000 Taxpayers Pay Half of All Income Taxes

Top 200,000: 56.6%; All other taxpayers: 43.4%

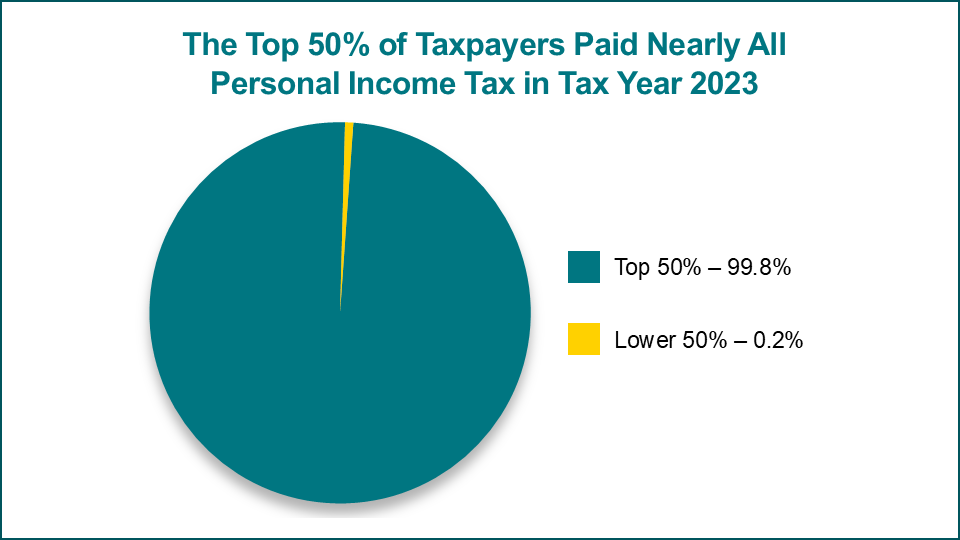
Pie chart of top 50% of taxpayers paid nearly all income tax

Top 50%: 99.3%; lower 50%: 0.7%

Top data points for tax year 2021, all returns
Taxpayer categories Number of taxpayers % of total taxpayers Liability ($) % of total taxes
Top 200 200 0.002% $6,482,428,376 9.5%
New York source millionaires 84,366 0.8% $32,938,708,671 48.5%
Top 200K 200,000 1.80% $38,401,300,884 56.6%
Top 25% 2,704,245 25.0% $61,216,639,100 90.2%
Top 50% 5,408,490 50.0% $67,388,922,472 99.3%
Lower 50% 5,408,489 50.0% $506,780,557 0.7%
Lower 25% 2,704,244 25.0% ($929,573,738) (1.4%)

More millionaires

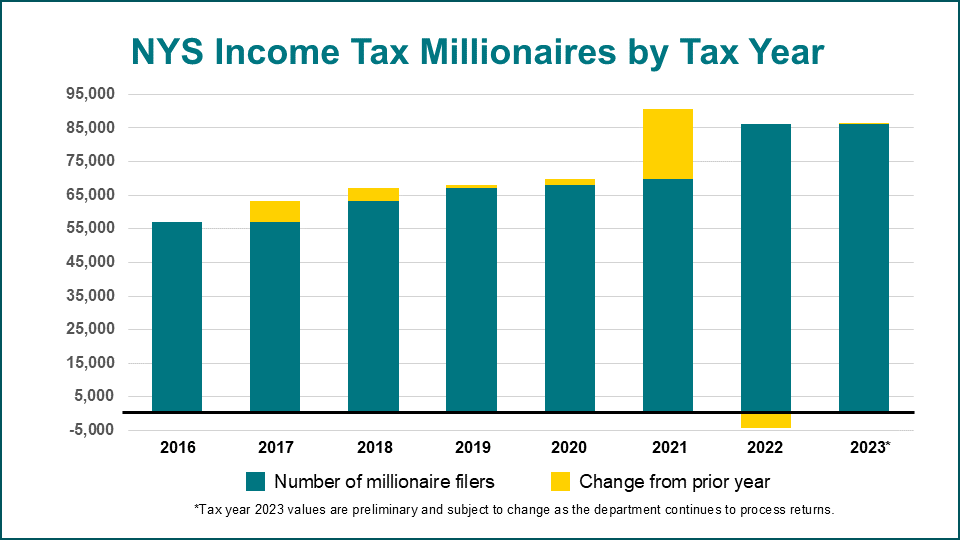
The number of tax returns reporting $1 million or more in income increased from 69,688 to 84,366 in 2021—the highest number in recent New York State history. 

Bar graph of total new york state income tax millionaires

General upward trend of number of millionaires in New York State from 2016 to 2021; growth of millionaires in the state in years from greatest to lowest: 2021, 2017, 2018, 2020, 2019

Total New York State income tax millionaires
Tax year Number of millionaire filers Change Percent change
2016 57,126 N/A N/A
2017 63,352 6,226 10.9%
2018 67,108 3,756 5.9%
2019 68,068 960 1.4%
2020 69,688 1,620 2.4%
2021 84,366 14,678 21.1%

Growth of millionaires

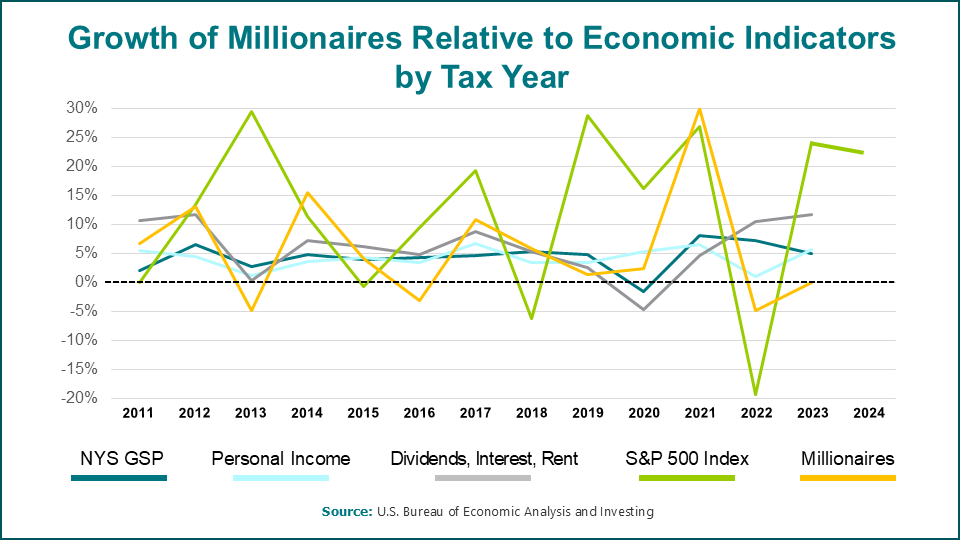
The number of millionaires moves loosely with the New York State economy.

Line graph of millionaires relative to economic indicators

Chart of the growth of millionaires relative to economic indicators from 2011 to 2022. Economic indicators are millionaires, gross state product, personal income, dividends, interest, and rent, and S&P 500.

Tax filing composition in New York State is changing

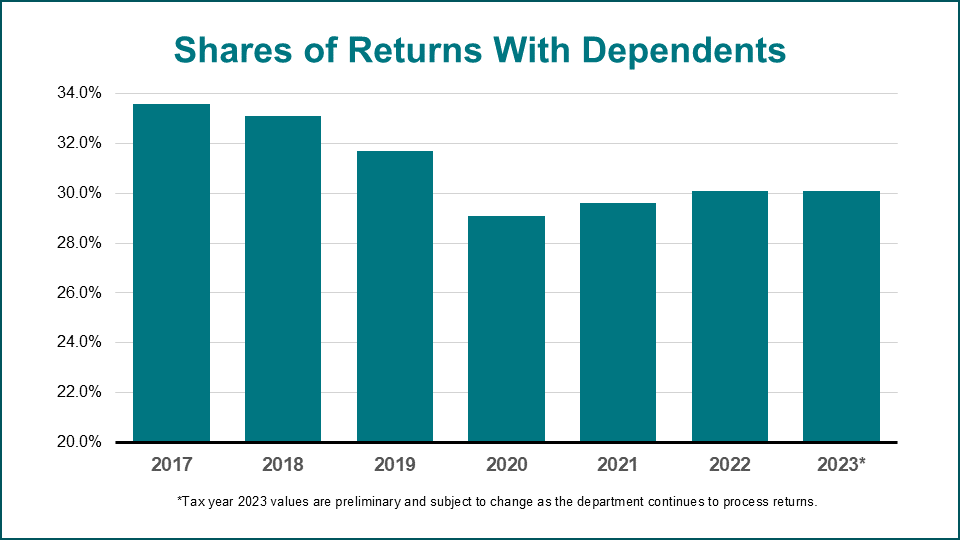
The share of residents claiming dependents on their tax filings dropped by more than 4 percentage points between 2017 and 2021. 

Line graph of tax filing composition in New York is changing

Graph showing the difference between share of returns with dependents and share of married residents filing jointly

Share of returns with dependents
Year 2017 2018 2019 2020 2021
Percentage of returns with dependents 33.6% 33.1% 31.7% 29.1% 29.5%

More single filers

Tax filing status distribution also shifted with single filers now comprising a majority of resident income tax returns.

Filing status: personal income tax returns, 2017–2021
Filing status 2017 2018 2019 2020 2021
Single 48.4% 48.9% 49.9% 52.1% 51.7%
Married filing jointly 32.8% 32.6% 31.9% 30.3% 30.3%
Head of household 16.3% 16.1% 15.5% 14.7% 15.1%
Married filing separately 2.3% 2.4% 2.6% 2.8% 2.9%

Fewer dependents

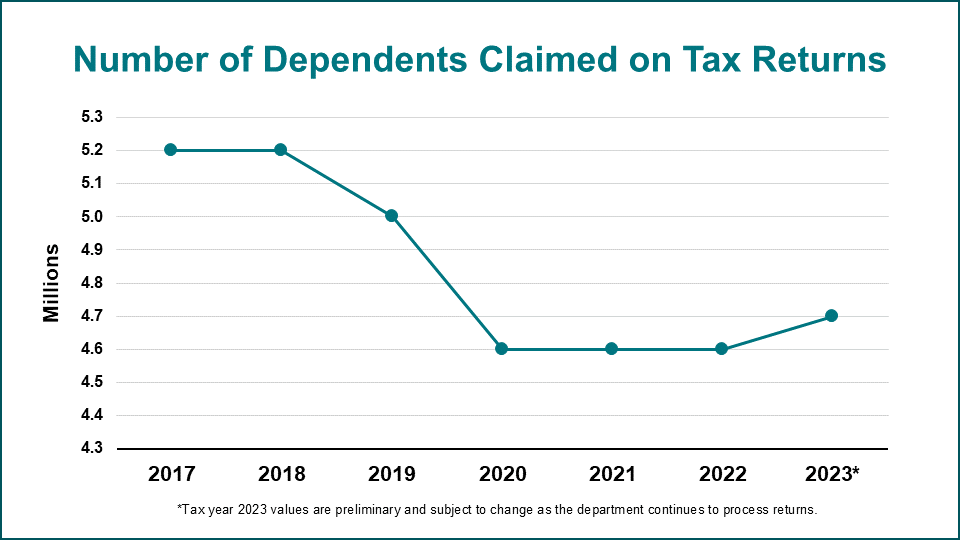
The number of dependents reported on New Yorkers’ tax returns markedly declined over the past 5 years. Residents claimed 600,000 fewer dependents in 2021 than 5 years ago.

Dependents claimed on tax returns
Year 2017 2018 2019 2020 2021
Number of dependents claimed on tax returns 5,208,648 5,154,394 4,986,703 4,647,815  4,605,678

  
Line graph of number of returns vs number of dependents

Graph of the difference between number of returns versus number of dependents claimed from 2017 to 2021

Additional child tax credit payments

More than 1.1 million families received nearly $223 million in additional Empire State child credit payments, helping to reduce child poverty in New York State. These critical payments supplemented $544.4 million in Empire State child credits claimed on 2021 tax returns.

Additional earned income credit payments

New York State returned more than $164 million in additional earned income credit payments to more than 840,000 state taxpayers to help combat inflation. That’s on top of $727.5 million in earned income credits claimed on their 2021 tax returns.

Free File

Most New York State taxpayers can file their tax returns electronically, using guided software, for free. More than 188,000 taxpayers used the Tax Department’s Free File option in 2022.

Updated: