Migration
Taxpayers changed addresses
Address updates are a combination of information received from taxpayers directly and information from the United States Postal Service (USPS) National Change of Address program. Some New York State resident taxpayers change their addresses to out-of-state locations each year. The tables and charts below track the cumulative number of out-of-state transitions observed throughout the year.
In 2020 and 2021 there were noticeable increases in address changes with the start of the COVID-19 pandemic. Address changes in 2022 and 2023 remained high but have tended back towards pre-pandemic levels.
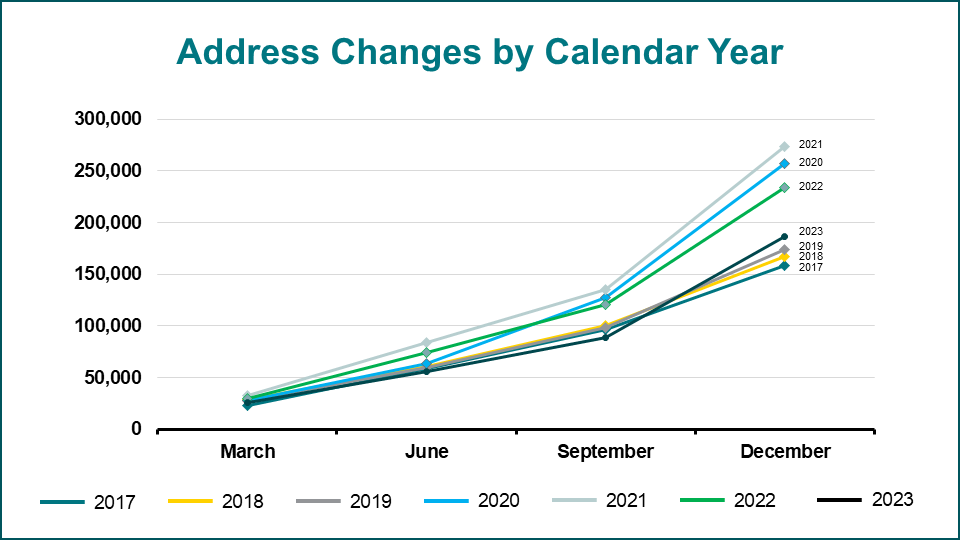
Taxpayer-reported address changes by calendar year, from 2017 to 2023. For exact numbers, see data table.
The number of tax returns fluctuates year to year creating variation in the number of address changes; proportions adjust for the different number of tax returns each year. Pre-pandemic, approximately 2% of addresses updated to out of the state each year. The rate accelerated to 3% in 2020 and 2021, declined slightly in 2022, and is close to 2% again in 2023.
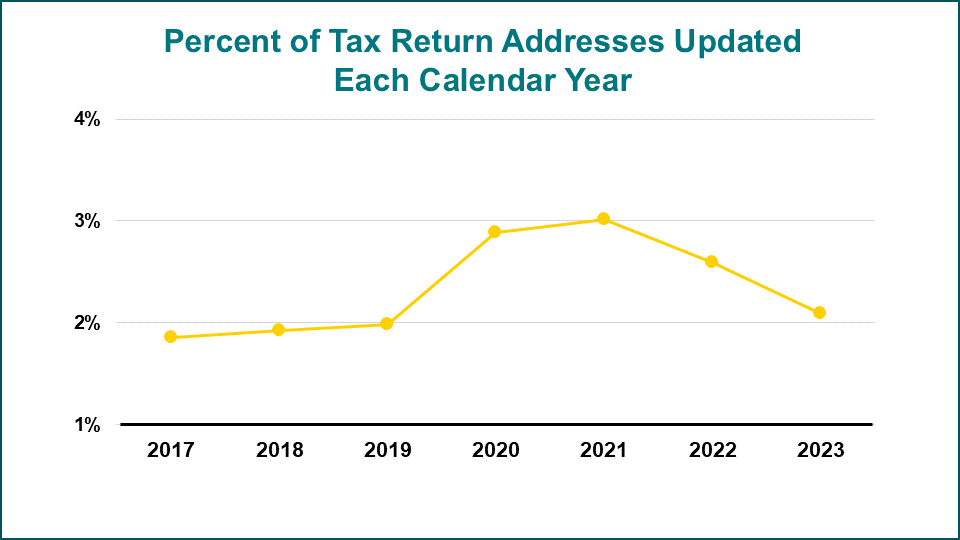
Percentage of taxpayers leaving New York by calendar year, from 2017 to 2023. For exact numbers, see data table.
Millionaires changed addresses
Tax filings combined with the change of address information discussed above allow a focus on high-income taxpayers. Tax returns with a New York State adjusted gross income of one million dollars or more are of particular interest due to the progressivity of the tax system. The pattern for millionaires resembles that of all tax returns. Address changes peaked in 2020 and slowly declined each subsequent year.
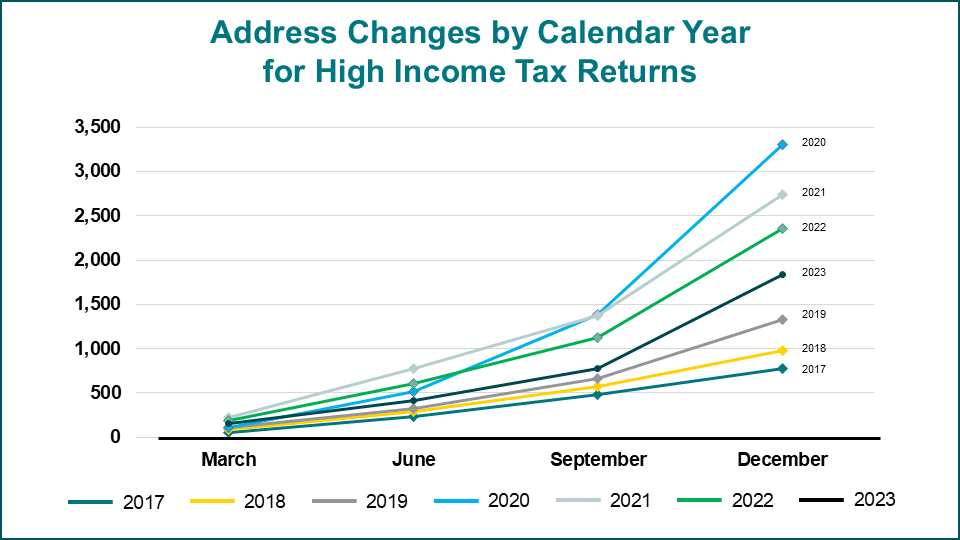
Millionaire-reported address changes by calendar year, from 2017 to 2023. For exact numbers, see data table.
The rate of out-of-state address changes is higher for millionaires. The percentage of high-income addresses changed peaked above 6% in 2020 and is now slightly below 3%. While still relatively high, it is approaching the rate for earlier years as well as that for taxpayers overall.
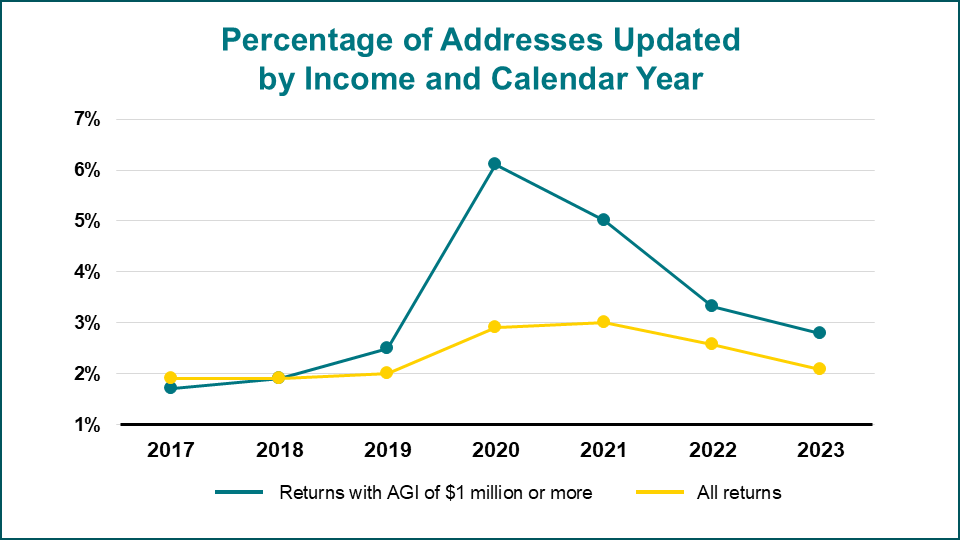
Percentage of millionaires compared to all taxpayers leaving New York State by calendar year, from 2017 to 2023. For exact numbers, see data table.
More than 1,800 millionaires changed their address to another state over the course of 2023. This is an improvement relative to the peak above 3,300 in 2020. The number is small relative to the total number of millionaires and yet smaller relative to total number of taxpayers. However, the resulting loss of tax dollars can be significant due to the concentration of tax liability.
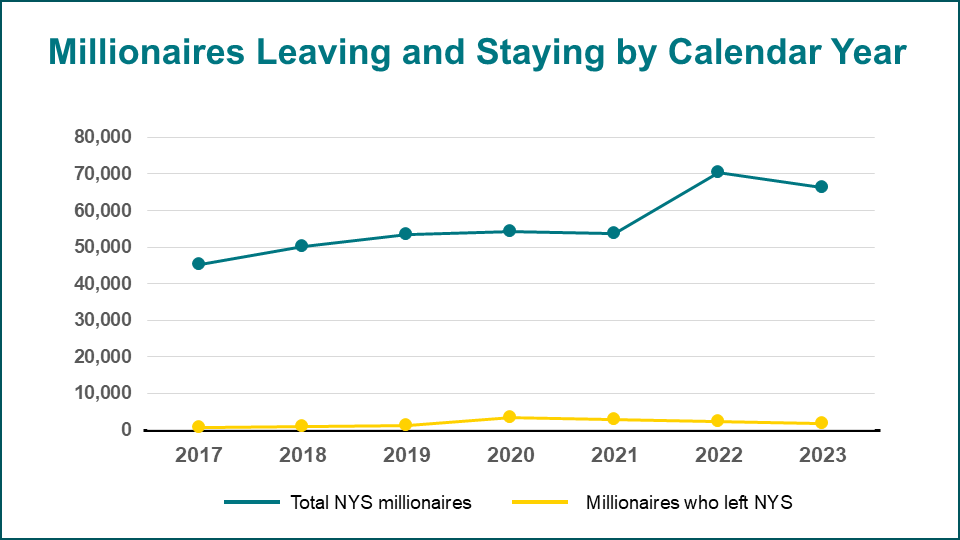
Millionaires leaving and staying in New York State by calendar year, from 2017 to 2023. For exact numbers, see data table.
Address changes of millionaires are approaching pre-COVID-19 rates. The wealthiest millionaires (those with incomes greater than $25 million) had the largest percentage increase and the largest recovery.
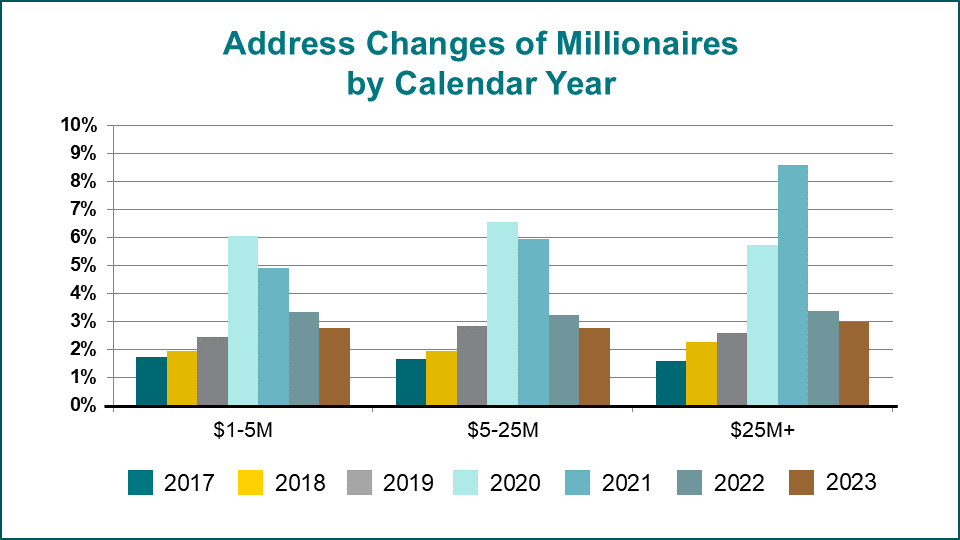
Address changes of millionaires by calendar year from 2017 to 2023. For exact numbers, see data table.
IRS state-to-state migration tally of tax returns
The Internal Revenue Service (IRS) tracks migration using personal income tax returns matched across adjacent years. New York has a long history of population turnover, inflow, and outflow. The most recent data is for 2021-22. While the level of outflow remains historically high, the net improved relative to the prior year.
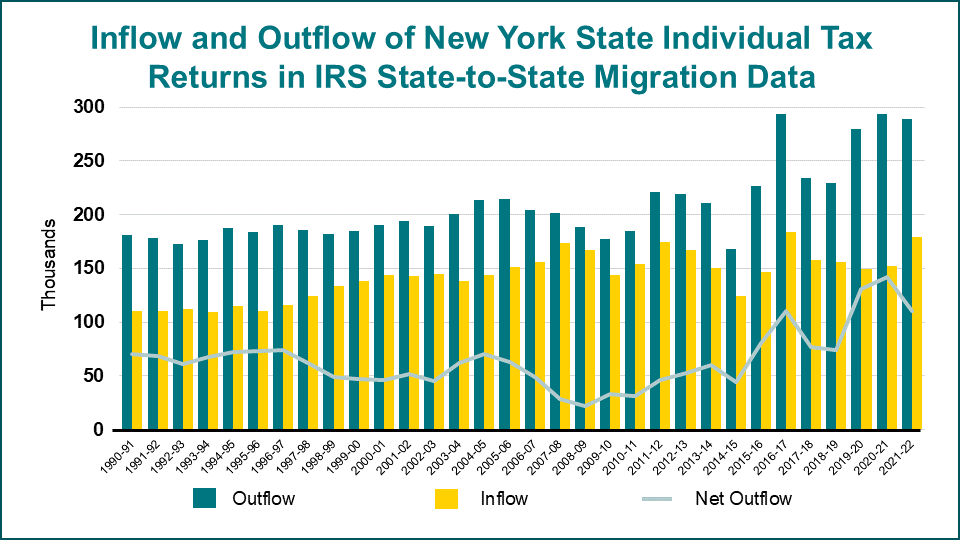
Inflow and outflow of New York State returns in IRS state-to-state migration data from 1990 to 2022. For exact numbers, see data table.
The 2021–2022 net outflow of 107,798 returns is concentrated in people between the ages of 26 and 44 as in prior years. However, the number is smaller than last year, and there is evidence of younger people with higher incomes coming into New York.
| Federal adjusted gross income (AGI) | All ages | Under 26 | 26–34 | 35–44 | 45–54 | 55–64 | 65 and over |
|---|---|---|---|---|---|---|---|
| All AGI | -107,798 | -187 | -27,584 | -29,221 | -16,905 | -16,773 | -17,128 |
| $1 under $10,000 | -4,433 | -465 | -1,178 | -701 | -442 | -534 | -1,113 |
| $10,000 under $25,000 | -16,844 | -2,996 | -5,023 | -3,440 | -1,871 | -1,609 | -1,905 |
| $25,000 under $50,000 | -30,349 | -3,168 | -10,350 | -7,077 | -4,119 | -3,069 | -2,566 |
| $50,000 under $75,000 | -15,418 | 1,703 | -5,169 | -4,642 | -2,551 | -2,418 | -2,341 |
| $75,000 under $100,000 | -10,586 | 1,740 | -2,907 | -3,411 | -1,949 | -2,058 | -2,001 |
| $100,000 under $200,000 | -18,128 | 2,226 | -2,612 | -6,044 | -3,538 | -4,068 | -4,092 |
| $200,000 or more | -12,040 | 773 | -345 | -3,906 | -2,435 | -3,017 | -3,110 |
The outflow of primary taxpayers under age 26 and age 26–34 in the 2021–2022 data is noticeably less than in the prior period.
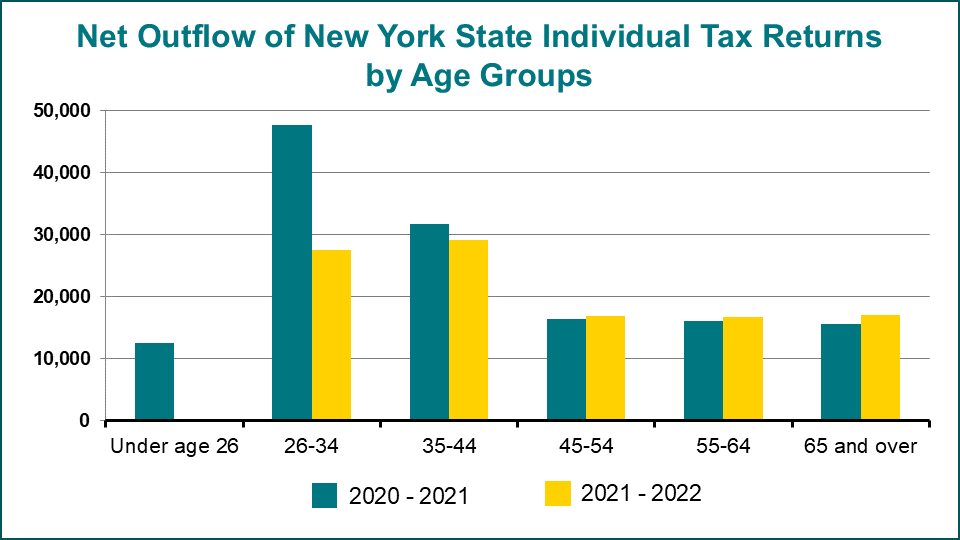
Outflow of primary taxpayers by age group from 2020 to 2021, and 2021 to 2022. For exact numbers, see data table.
New Yorkers head towards warmer, neighboring, and less expensive states

Map of U.S. showing each state's net flow of individual tax returns. For exact numbers, see data table.
Even the states with the largest net outflow on the map also have people moving into New York.
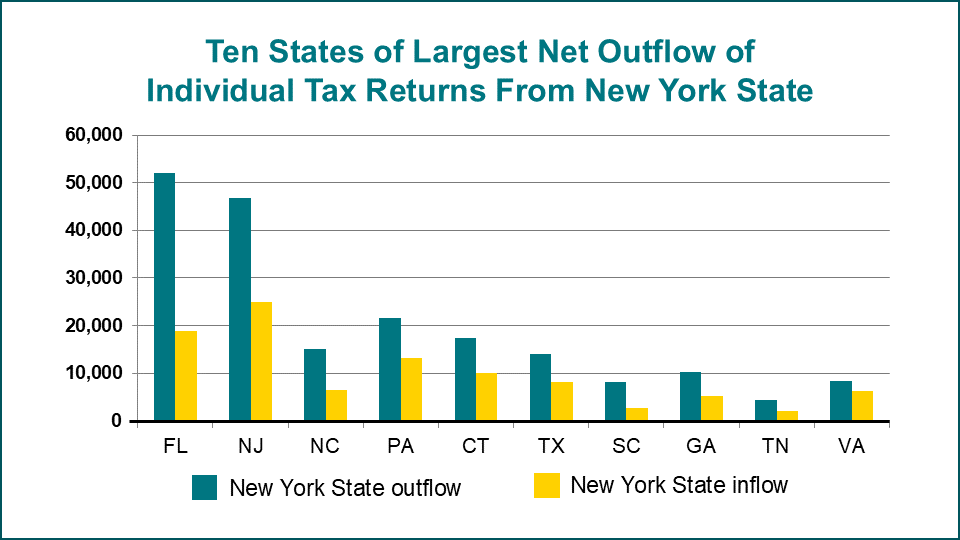
Ten states of largest net outflow from New York State tax returns. For exact numbers, see data table.