Corporate taxes
Corporate tax collections
New York State collected more than $7.5 billion in Article 9-A corporation franchise taxes in fiscal year 2023–2024. This was an increase of more than $240 million from the prior fiscal year.
| Fiscal year | 2019 | 2020 | 2021 | 2022 | 2023 | 2024 |
|---|---|---|---|---|---|---|
| Corporation franchise tax collections (in millions) | $3,391.8 | $3,771.8 | $3,879.7 | $5,793.2 | $7,260.8 | $7,502.0 |
Tax year filing and data timing
The combination of filing extensions and fiscal-year filing periods results in a lag between when returns are filed and when complete tax year data are available.
Example: A fiscal year filer with a December 2023–November 2024 liability period would be required to file its return in March 2025. If the entity uses the full one-year extension, the 2023 return would not be submitted to the department until March 2026.
Extensions of time to file
Article 9-A taxpayers are required to file tax returns by the 15th day of the 4th month following the close of the tax year (April 15th for calendar-year filers). In addition, filers may extend the statutory due date for up to one year through the use of one six-month extension and two additional three-month extensions.
More than half of the corporate franchise taxpayers file by the statutory deadline, but those entities make up less than 10% of the total tax. Meanwhile, more than 60% of the overall Article 9-A tax comes from the less than 2% of taxpayers that use either a nine-month or one-year extension.
| Extension status | Percent of taxpayers | Percent of total tax |
|---|---|---|
| No extension | 57.6% | 7.1% |
| Six-month extension | 40.7% | 31.1% |
| Nine-month extension | 1.6% | 49.8% |
| One-year extension | 0.1% | 12.0% |
| Total | 100.0% | 100.0% |
Tax years: Calendar year vs. fiscal year
Corporate franchise taxpayers file either on a calendar year (January–December) or a fiscal year (the liability period begins in a month other than January). Two-thirds of Article 9-A taxpayers use a calendar year, reporting almost 75% of the total Article 9-A liability.
| Liability period begin month | Number of taxpayers | Percent of taxpayers | Tax (in millions) | Percent of total tax |
|---|---|---|---|---|
| January | 211,785 | 66.4% | $4,407.3 | 74.3% |
| February | 7,678 | 2.4% | $311.9 | 5.3% |
| March | 8,869 | 2.8% | $35.1 | 0.6% |
| April | 12,761 | 4.0% | $232.5 | 3.9% |
| May | 8,869 | 2.8% | $45.2 | 0.8% |
| June | 9,082 | 2.9% | $59.7 | 1.0% |
| July | 13,479 | 4.2% | $272.2 | 4.6% |
| August | 8,867 | 2.8% | $82.0 | 1.4% |
| September | 8,897 | 2.8% | $50.6 | 0.9% |
| October | 12,510 | 3.9% | $297.1 | 5.0% |
| November | 8,947 | 2.8% | $80.4 | 1.4% |
| December | 7,364 | 2.3% | $55.7 | 0.9% |
| 2021 tax year total | 319,108 | 100.0% | $5,929.7 | 100.0% |
Corporate franchise tax composition
The number of corporate tax filers, and the associated liability, continues to grow since the corporate franchise tax was restructured in 2015.
| Tax liability year | 2015 | 2016 | 2017 | 2018 | 2019 | 2020 | 2021 |
|---|---|---|---|---|---|---|---|
| Number of taxpayers | 281,374 | 284,605 | 293,302 | 302,909 | 311,233 | 311,147 | 319,108 |
| Liability (in millions) | $3,238.5 | $2,836.5 | $2,710.4 | $4,037.5 | $4,052.0 | $4,127.9 | $5,929.7 |
Almost 75 percent of the corporation franchise tax burden is carried by less than 0.25 percent of filers. Nearly 80 percent of corporate franchise taxpayers pay less than $1,000 in tax.
| Tax year | Tax amount | Number of taxpayers | Percent of total taxpayers | Tax (in millions) | Percent of total tax |
|---|---|---|---|---|---|
| 2015 | less than or equal to $999 | 219,150 | 77.9% | $33.4 | 1.0% |
| greater than or equal to $1 million | 478 | 0.2% | $2,152.3 | 66.5% | |
| 2016 | less than or equal to $999 | 224,212 | 78.8% | $37.6 | 1.3% |
| greater than or equal to $1 million | 406 | 0.1% | $1,869.5 | 65.9% | |
| 2017 | less than or equal to $999 | 232,406 | 79.2% | $37.1 | 1.4% |
| greater than or equal to $1 million | 394 | 0.1% | $1,757.8 | 64.9% | |
| 2018 | less than or equal to $999 | 240,874 | 79.5% | $37.7 | 0.9% |
| greater than or equal to $1 million | 494 | 0.2% | $2,965.1 | 73.4% | |
| 2019 | less than or equal to $999 | 249,720 | 80.2% | $38.8 | 1.0% |
| greater than or equal to $1 million | 474 | 0.2% | $2,988.5 | 73.8% | |
| 2020 | less than or equal to $999 | 254,532 | 81.8% | $35.2 | 0.9% |
| greater than or equal to $1 million | 484 | 0.2% | $3,052.6 | 74.0% | |
| 2021 | less than or equal to $999 | 251,280 | 78.7% | $35.5 | 0.6% |
| greater than or equal to $1 million | 736 | 0.2% | $4,441.5 | 74.9% |
Article 9-A filers are subject to the highest of three bases—business income base, business capital base, or the fixed dollar minimum tax based on New York receipts.
While more than two-thirds of Article 9-A filers pay on the fixed dollar minimum base, more than 90% of the tax comes from the income base.
| Tax base | Number of taxpayers | Percent of taxpayers | Tax (in millions) | Percent of total tax |
|---|---|---|---|---|
| Entire net income | 68,977 | 21.6% | $5,371.4 | 90.6% |
| Fixed dollar minimum | 228,371 | 71.6% | $80.6 | 1.4% |
| Capital | 21,760 | 6.8% | $477.7 | 8.1% |
| 2021 Tax Year Total | 319,108 | 100.0% | $5,929.7 | 100.0% |
Article 9-A New York receipts by type
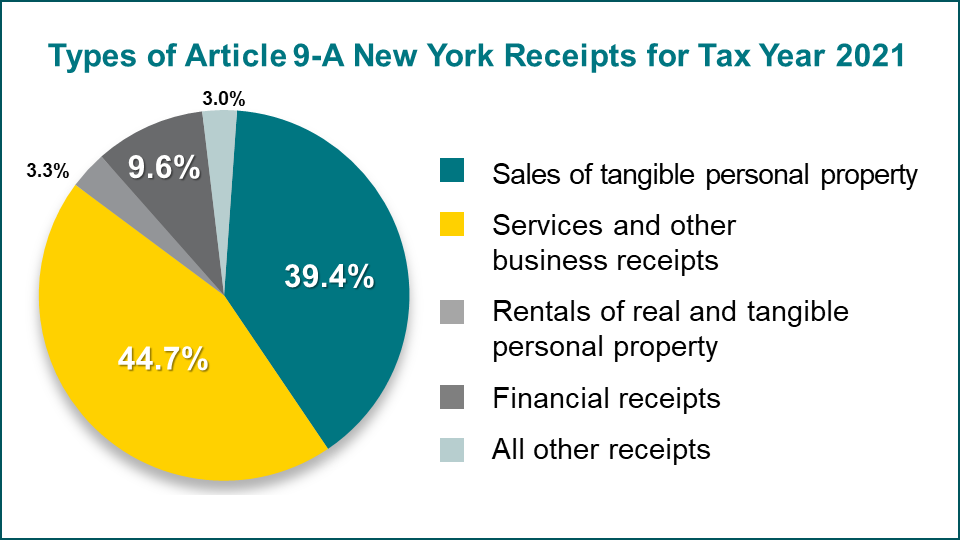
Article 9-A taxpayers reported more than $24 trillion dollars across more than 50 different types of enumerated receipts, with more than $1.2 trillion of that amount sourced to New York State in 2021.

Types of Article 9-A New York receipts for tax year 2021. For exact numbers, see data table.
S corporations
Over 450,000 S corporations are required to pay an entity-level franchise tax under Article 9-A, ranging from $19 to $4,500 depending on the type of business and the amount of New York receipts. Shareholders of New York S corporations report the flow-through income from these corporations on their personal income tax returns. The number of New York S corporations continues to grow annually.
| Tax year | Count | Article 9-A franchise tax liability (in millions) |
|---|---|---|
| 2015 | 421,107 | $126.8 |
| 2016 | 427,341 | $123.3 |
| 2017 | 435,409 | $126.8 |
| 2018 | 443,855 | $138.5 |
| 2019 | 450,685 | $129.9 |
| 2020 | 450,926 | $120.1 |
| 2021 | 457,822 | $134.9 |
Other corporate tax collections
Approximately 1,200 utility, telecommunications, and transportation companies and 1,300 insurance companies also pay almost $3 billion in corporate taxes.
| Fiscal year | 2019 | 2020 | 2021 | 2022 | 2023 | 2024 |
|---|---|---|---|---|---|---|
| Article 9 tax collections (in millions) | $805.1 | $832.6 | $715.2 | $735.8 | $720.2 | $751.1 |
| Insurance tax collections (in millions) | $1,489.6 | $1,918.5 | $1,799.3 | $1,991.2 | $2,157.0 | $2,202.8 |
